Search News Results
South Africa Merchandise Trade Statistics for February 2016
The South African Revenue Service (SARS) has released trade statistics for February 2016 that recorded a trade deficit of R1.07 billion. This figure includes trade data with Botswana, Lesotho, Namibia and Swaziland (BLNS).
Including trade data with Botswana, Lesotho, Namibia and Swaziland (BLNS)
The R1.07 billion deficit for February 2016 is due to exports of R90.68 billion and imports of R91.75 billion, improving from a revised deficit of R17.96 billion in January 2016. Exports increased from January 2016 to February 2016 by R19.29 billion (27.0%) and imports increased from January 2016 to February 2016 by R2.39 billion (2.7%).
On a year-on-year basis, the R1.07 billion deficit is an 85.8% decrease on the deficit recorded in February 2015 of R7.53 billion. Exports of R90.68 billion are 16.5% more than the exports recorded in February 2015 of R77.82 billion. Imports of R91.75 billion are 7.5% more than the imports recorded in February 2015 of R85.35 billion.
The cumulative deficit for 2016 of R19.03 billion is 38.5% less than the deficit for the comparable period in 2015 of R30.96 billion.
The month of January 2016 trade balance deficit was revised upwards by R0.09 billion from the previous month’s preliminary deficit of R17.87 billion to a revised deficit of R17.96 billion.
Trade highlights by category
The month-on-month export movements (R’ million):
| Section: | Including BLNS: | |
| Vehicle & Transport Equipment | + R6 596 | + 109.1% |
| Precious Metals & Stones | + R5 908 | + 51.9% |
| Machinery & Electronics | + R1 962 | + 28.1% |
| Vegetable Products | + R1 279 | + 34.8% |
| Mineral Products | - R1 373 | - 8.2% |
The month-on-month import movements (R’ million):
| Section: | Including BLNS: | |
| Vehicle & Transport Equipment | + R 1 671 | + 19.1% |
| Equipment Components | + R 939 | + 13.3% |
| Textiles | + R 898 | + 24.1% |
| Vegetable Products | + R 677 | + 28.5% |
| Machinery & Electronics | - R1 668 | - 6.9% |
| Mineral Products (Including Crude Oil) | - R 620 | - 5.7% |
Trade highlights by world zone
The world zone results from January 2016 to February 2016 are given below.
Africa:
Trade surplus: R14 320 million – this is a 21.4% increase in comparison to the R11 798 million surplus recorded in January 2016.
America:
Trade deficit: R2 606 million – this is a 27.1% decrease in comparison to the R3 573 million deficit recorded in January 2016.
Asia:
Trade deficit: R13 365 million – this is a 24.1% decrease in comparison to the R17 620 million deficit recorded in January 2016.
Europe:
Trade deficit: R7 060 million – this is a 44.6% decrease in comparison to the R12 752 million deficit recorded in January 2016.
Oceania:
Trade surplus: R 517 million – this is an improvement in comparison to the R 285 million deficit recorded in January 2016.
Excluding trade data with Botswana, Lesotho, Namibia and Swaziland (BLNS)
The trade data excluding BLNS for February 2016 recorded a trade deficit of R9.21 billion, with exports of R79.39 billion and imports of R88.60 billion. Exports increased from January 2016 to February 2016 by R18.15 billion (29.6%) and imports increased from January 2016 to February 2016 by R1.82 billion (2.1%).
The cumulative deficit for 2016 is R34.76 billion compared to R46.38 billion in 2015.
Trade highlights by category
The month-on-month export movements (R’ million):
| Section: | Excluding BLNS: | |
| Vehicles & Transport Equipment | + R6 204 | + 120.9% |
| Precious Metals & Stones | + R5 665 | + 53.7% |
| Machinery & Electronics | + R1 618 | + 28.6% |
| Prepared Foodstuff | + R1 442 | + 80.3% |
| Vegetable Products | + R1 253 | + 40.3% |
The month-on-month import movements (R’ million):
| Section: | Excluding BLNS: | |
| Vehicles & Transport Equipment | + R1 657 | + 19.1% |
| Equipment Components | + R 939 | + 13.3% |
| Textiles | + R 788 | + 23.2% |
| Vegetable Products | + R 690 | + 29.7% |
| Machinery & Electronics | - R1 730 | - 7.3% |
Trade highlights by world zone
The world zone results for Africa excluding BLNS from January 2016 to February 2016 are given below.
Africa:
Trade surplus: R6 173 million – this is a 46.3% increase in comparison to the R4 218 million surplus recorded in January 2016.
Botswana, Lesotho, Namibia and Swaziland (Only)
Trade statistics with the BLNS for February 2016 recorded a trade surplus of R8.15 billion, with exports of R11.29 billion and imports of R3.14 billion. Exports increased from January 2016 to February 2016 by R1.14 billion (11.2%) and imports increased from January 2016 to February 2016 by R0.57 billion (22.1%).
The cumulative surplus for 2016 is R15.73 billion compared to R15.42 billion in 2015.
Trade Highlights by Category
The month-on-month export movements (R’ million):
| Section: | BLNS: | |
| Vehicles & Transport Equipment | + R 392 | + 42.8% |
| Machinery & Electronics | + R 343 | + 26.2% |
| Precious Metals & Stones | + R 244 | + 29.3% |
| Prepared Foodstuff | - R 343 | - 25.5% |
| Mineral Products | - R 298 | - 16.1% |
The month-on-month import movements (R’ million):
| Section: | BLNS: | |
| Chemical Products | + R 122 | + 22.4% |
| Precious Metals & Stones | + R 115 | + 31.0% |
| Textiles | + R 110 | + 33.3% |
| Live Animals | + R 67 | + 41.9% |
| Machinery & Electronics | + R 62 | + 23.6% |
Related News


The importance of investing in built-to-last infrastructure
The Global Infrastructure Forum being organized by multilateral development banks (MDBs) next month in Washington, D.C. comes at an opportune time. The adoption of the Sustainable Development Goals and the Paris Agreement on climate action have generated valuable political momentum to set the world on a path toward better and more sustainable development outcomes.
Infrastructure is at the core of this agenda. It is a major driver of economic growth and inclusive development. It is also key to tackling climate change. Done badly, it is a major part of the problem; infrastructure currently accounts for around 60 percent of the world’s greenhouse gas (GHG) emissions. Done right, it is a major part of the solution; sustainable infrastructure mitigates GHG emissions and builds resilience to climate change.
Globally, investment needed in infrastructure over the next 15 years is estimated at more than $90 trillion. On an annual basis, infrastructure investment will have to more than double from $2.5-3 trillion currently to more than $6 trillion. As much as three-quarters of the new investment will need to take place in the developing world, particularly middle-income economies. The estimated investment needs over the next 15 years are almost twice the value of the entire infrastructure stock today. This presents a big challenge, but also an opportunity to remake our physical environment in a better way.
The world needs to build more infrastructure but build it to last in the new climate economy. There is a great danger of locking in high-carbon, polluting, and unsustainable pathways if the new infrastructure is built in much the same way as before. But if the new investments are designed to factor in climate risks, they can not only bridge the infrastructure gap to support growth and development but also protect the climate. This means investing in renewable energy, cleaner transport, efficient and resilient water systems, and smarter cities.
Delivering sustainable infrastructure at scale will require strong public policy leadership and active private-sector engagement, including important transformations in the way infrastructure investments are developed and financed. Specific actions must be tailored to individual country circumstances. However, the main elements of the agenda can broadly be captured under four “I”s: investment, incentives, institutions, and innovation.
Boosting investment in infrastructure to more than twice current levels will require substantial increases in public sector’s own investment and policies to catalyze a major scale-up of private investment. The generally negative trend in public investment rates over the past couple of decades, which exacerbated infrastructure gaps, must be reversed. Given the scale of the needs, and fiscal constraints in many countries, more than half of the new investment will have to come from the private sector. Policy risks and costs of doing business must be reduced to attract more private investment.
Market incentives must be reformed to orient new investment towards sustainable infrastructure. Removal of fossil-fuel subsidies and implementation of carbon pricing are crucial. The current low petroleum prices provide an opportunity to jumpstart reform. Pricing reform is also needed in sectors beyond energy, such as water. Getting prices right and reforming regulation to correct incentive distortions put markets to work in support of public policy goals.
The quality and impact of higher investment will depend greatly on the strength of public institutions. Especially important are capacities to develop strong pipelines of sustainable projects and improve institutional frameworks for public-private partnerships. As much as 70 percent of total investment in sustainable infrastructure will be connected with urban areas. So institutional and fiscal strengthening of cities merits particular attention.
Technological innovation expands possibilities by providing new and more efficient technologies for low-carbon, climate-resilient infrastructure. Fiscal and financial innovation will be important in capturing those possibilities. Investment in research and development, notably in renewable energy technologies, should be boosted. Mobilizing financing for sustainable infrastructure at scale will require enhancing and creatively utilizing fiscal space, and leveraging private finance and lowering its cost through innovations in financial instruments and use of development capital. Carbon taxation can raise substantial revenue as well as improve tax structure. Globally, assets under management by banks and institutional investors amount to more than $120 trillion but only about 5 percent of those are invested in infrastructure. Innovations to promote infrastructure as an asset class and tap these large pools of savings will have a high payoff.
The foregoing public policy agenda is primarily the responsibility of national governments. But there is an important role for international cooperation through collective actions and technical and financial support. For emerging and developing economies, MDBs in particular will be a key partner in building capacities and mobilizing financing. The scale of the sustainable infrastructure challenge will require enhancements in the capabilities of these institutions. The Global Infrastructure Forum provides an important opportunity for the MDBs and their development partners to translate the current favorable political momentum into a more concrete action agenda to step up sustainable infrastructure development. It must not be missed.
Zia Qureshi is currently a Nonresident Senior Fellow in the Global Economy and Development program. Formerly, he was a Director in the Development Economics Department of the World Bank.
Related News


Trade turbulence
China’s transition to a new growth path is contributing to trade volatility today and will shape trade opportunities tomorrow
Global trade has been a puzzle lately. In the 2000s, and especially after the Great Recession, trade growth has been persistently sluggish relative to GDP. And 2015 appears to have added a new dimension: volatility. Available data indicate that global trade contracted sharply in the first half of the year before beginning to grow again, albeit slowly.
In a previous article (“Slow Trade,” in the December 2014 F&D), we examined the cyclical and structural factors behind the global trade slowdown: weak demand, maturing value chains, and slower trade liberalization than in the 1990s. These forces are all still at work and contributed to the weak growth of world trade in 2015.
The trade fluctuations in 2015 may reflect turbulence as China adjusts to a new, slower growth path that is less dependent on investment and industrial production. China’s transition has strikingly different implications for countries depending on their main exports. Some of these effects are temporary; others are more structural. Manufacturers (especially in east Asia) suffered significant declines in export quantities but are now recovering; commodity producers were hurt primarily by lower export prices, which persist; and services exporters have benefited in a way that could presage future opportunities.
A most peculiar year
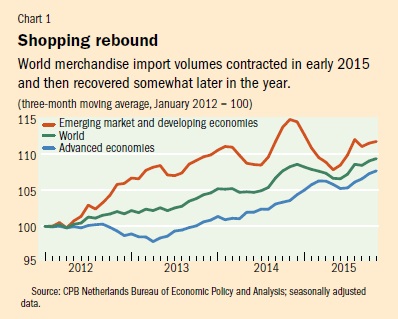
After a period of low but fairly consistent trade growth, preliminary data for 2015 show a sudden contraction in trade volume of about 3 percent quarter over quarter in the first half of the year (see Chart 1). In the third quarter of 2015, growth appears to be positive again but weaker than in the second half of 2014. The contraction and partial rebound were concentrated in emerging market economies.
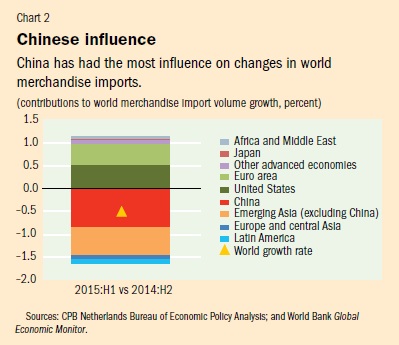
Emerging Asia, which accounts for more than a quarter of world trade, seems to have been the epicenter of the 2015 trade downturn and incipient rebound. According to preliminary figures, in the first half of 2015 emerging Asia’s imports dropped by 10 percent, accounting for nearly 90 percent of the contraction in world import volumes. China alone saw a contraction in import volumes of 15 percent and was responsible for more than half of the contraction in world imports (see Chart 2). The reversal of these trends in the region in the third quarter is contributing to the rebound that we observe in world trade, although trade growth in 2015 was still weaker than in 2014. Developments in other regions also matter. In particular, lower imports from crisis-stricken commodity exporters such as Brazil and Russia – in part reflecting lower demand in China, as discussed below – have contributed to falling global imports.
Napoleon’s prophecy
Napoleon is reputed to have said, “When China wakes, the world will shake.” Indeed, short-term macroeconomic fluctuations as China’s economy shifts from investment and manufacturing to consumption and services are affecting the pattern of production and trade in east Asia and beyond. These changes are manifested in manufacturing, commodities, and services trade.
On the production side, the slowdown in GDP has been concentrated in the industrial sector, which depends more on imported inputs than do other sectors of the economy; imported inputs make up 11.5 percent of total inputs in the industrial sector and only about 6 percent in other sectors. On the demand side, the slowdown is more significant in investment, which has greater, though declining, import intensity than other components of total demand. The import intensity of China’s investment is more than 50 percent higher than that of its consumption. Investment-related imports account for almost 60 percent of China’s total imports, and for 11 percent of the world’s investment-related imports (second only to the United States).
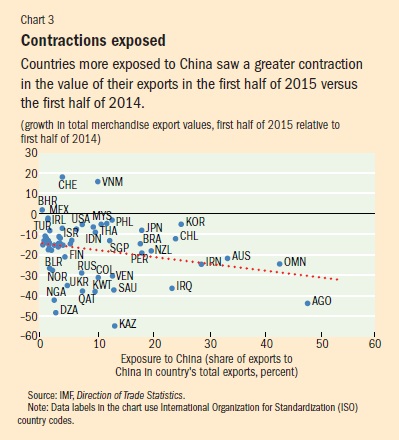
The contraction in China’s imports was distributed across all the regions of the world. Countries more exposed to China, as measured by that country’s share in their total exports, tended to see a greater contraction in the value of their exports in the first half of 2015 than in the corresponding period in 2014 (see Chart 3). Bilateral trade data for the third quarter are not yet available. A 1 percent higher exposure to China meant a 0.3 percent greater contraction in the growth of value of a country’s exports. The reduction in value of exports was attributable to lower prices and lower quantities, varying across regions depending on the composition of their exports. The slower growth in imports from large commodity exporters, such as those in the Middle East and sub-Saharan Africa, reflects the recent drop in prices; the sizable contraction in imports from emerging Asia, especially in the first quarter of 2015, resulted largely from lower quantities.
Magnifying chains
The impact on manufacturing was most visible in east Asia, which experienced a regional trade collapse. China is an important ultimate destination for the value-added exports of other Asian countries. Data available for five countries in east and south Asia indicate that about 50 percent of gross exports of these countries to China constitute value added that is ultimately absorbed in China, and therefore fully dependent on Chinese demand. Another 20 percent of regional exports are reexported by China and consumed in third countries, and therefore not dependent on China’s demand. The remainder constitutes foreign value added in a particular country’s gross exports to China, which originates elsewhere in the region and beyond.
The impact of macroeconomic changes in China may have been magnified by changes in the composition of economic activity. Production shifted away from sectors that are associated with global value chains – that is, from industrial production to services and, within industrial production, from capital goods (equipment and machinery) to consumption goods. Given the extensive network of supply chains in east Asia, this magnification effect likely affected intraregional trade flows more than interregional trade.
In the longer term, the recovery of global trade will, on one hand, be limited by diminished growth in demand in China; on the other hand, it will be boosted by the relocation of production away from China toward other lower-cost economies. Rebalancing from investment to consumption is likely to create opportunities for exporters of final goods and may also eventually boost upstream intermediate and capital goods sectors that are now adversely affected.
Nominal troubles and real opportunities
Commodity exporters saw no decline in export volumes. Exporters in Africa, the Middle East, eastern Europe and central Asia, and Latin America did experience lower trade values, but that was largely because of falling commodity prices – that is, a nominal rather than a real contraction. This evidence suggests primarily a price response to expectations of diminished demand for commodities and enhanced supply in sectors like oil and gas. Nevertheless, deterioration in the terms of trade for commodity producers has hurt real incomes for that group and contributed to recessions in countries such as Brazil and Russia, leading to a further contraction in commodity exporters’ import volumes.
Africa and the Middle East are emblematic of these nominal troubles. Having experienced the deepest plunge in export values since mid-2014, Africa and the Middle East contributed significantly to the recent decline in world trade values. Mostly a nominal phenomenon driven by changing prices, the downturn in oil and commodity exports also reflects sluggish volume growth in recent years. China and other emerging Asian economies together account for more than half of the decline in export values of Africa and the Middle East.
The rebalancing of the economy from investment to consumption is also shifting China’s demand from goods to services. Some of this demand is being served by cross-border imports and consumption abroad – whose growth is already visible. Available data indeed show the different dynamics of goods and services imports in recent years, with slowing imports of goods and rising imports of services, especially travel (see Chart 4). The latter may reflect consumption abroad of services ranging from tourism to education and health. But it is also possible that these data capture other short-term factors such as disguised or illegal capital outflows.
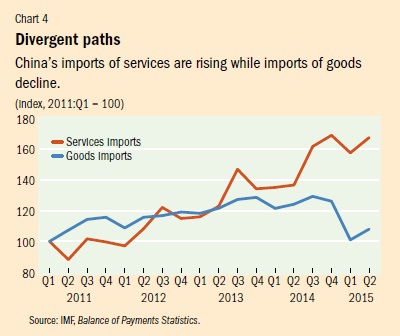
Services imports are growing, but trade in goods still dominates. The net effect is influenced largely by the decline in imports of goods, because services were a relatively small share of total imports of China in 2014. But the share of services has grown – from about 15 percent at the beginning of 2011 to close to 22 percent in the first half of 2015.
Mind the transition
Looking ahead, the rebalancing of the Chinese economy will unquestionably influence trends in world trade. But how the transition is managed will affect how much global trade fluctuates in the coming years.
Diminished growth in China, as well as the national shift in emphasis from investment to consumption, is affecting manufacturing and commodity exporters. The changing composition of demand is likely to favor exporters of consumption goods and eventually of upstream intermediate and capital goods used in their production. In the longer term, rising wages in China may also encourage industrial production and exports in lower-cost economies, and in turn enhance demand for commodities. Finally, the rebalancing is also shifting China’s demand from goods to services, and these imports may grow even faster if services markets continue to open up.
Cristina Constantinescu is an Economist and Michele Ruta is a Lead Economist, both in the Trade & Competitiveness Global Practice of the World Bank, and Aaditya Mattoo is Research Manager, Trade and International Integration, at the World Bank.
This article is based on a World Bank report by the authors, “Global Trade Watch: Spillovers from China’s Rebalancing.”
Related News


tralac’s Daily News Selection
The selection: Wednesday, 30 March 2016
Featured alerts, commentary:
South Africa’s February 2016 trade data will be released tomorrow. Bloomberg consensus sees a compression of the deficit to -R4.3bn.
The Commonwealth Trade Expert Group is meeting in Delhi, discussing 'Revitalising global trade and multilateralism'
Joshua P Meltzer: 'New trade deals challenge Africa to step on to the global stage' (The Guardian)
Rwanda: Trade deficit grows in first two months of 2016 (New Times)
According to a statement from the central bank yesterday, the country’s trade deficit widened to $297.2m (about Rwf232.4bn) largely due to an increase in formal imports that rose by about 7.2%, as well as a 9.7% decrease in the value of Rwanda’s exports. The international trade developments were among the focus of discussions during yesterday’s quarterly financial stability committee and monetary policy committee meetings chaired by the National Bank of Rwanda governor, John Rwangombwa.
South Africa: Poultry crowd rubs salt in own wounds (Business Day)
The South African Poultry Association is trying to get the South African International Trade Administration Commission to institute an agricultural safeguard on EU chicken. An agricultural safeguard is not dissimilar in effect to the antidumping duty that is no longer imposed on US bone-in chicken, except that it operates in three-year cycles. The association is essentially looking to institute protectionist action in the form of a 37% import tariff on EU bone-in chicken. [The author, David Wolpert, is CEO of the Association of Meat Importers and Exporters SA] [Call for steps against duty-free European chicken] [AGOA sword will keep hanging above SA]
Kenya's tea sector: value chain capacity assessment project launch (ACBF)
The assessment will undertake a comprehensive review of capacity assets, needs and options for strengthening capacity of key targeted institutions responsible in the value-chain of the tea product. The review will also identify structural and institutional factors including agents that can influence change resulting from a capacity development investment to improve the performance of the product. These factors will include the conduciveness of the socio-political environment, efficiency of prevailing policy instruments, effectiveness of organizational arrangements, as well as technical skills and knowledge. The assessment is expected to be finalized by the end of May 2016. [Further details: KIPPRA]
Recent papers published by the COMESA Monetary Institute:
Challenges of dollarization in COMESA: Governors noted the following recommendations from the study [extract] : i) Successful de-dollarization requires implementation of an appropriate mix of sound macroeconomic policies, market-based incentives, and micro-prudential measures including: ii) There is need for countries to avoid policies that may lead to stagflation and severe macroeconomic disruptions which precipitates the need for dollarization.
Enhancing the effectiveness of fiscal policy for domestic resource mobilization in the COMESA region: In the COMESA region, as elsewhere, fiscal policy can and should be used effectively to foster growth, reduce short term fluctuations of economic activity and maintain economies close to their potential growth paths. The necessity to carry out these tasks is emphasized by the following conclusions [extract]: i) Domestic revenue to GDP ratios remain low for most member countries (figure 2) attributed to among others low per capita income and growth, institutional problems and weak governance. Addressing these challenges provides a case for fiscal policy in domestic resource mobilization. [COMESA Committee of Governors of Central Banks: meeting report, 19 November 2015]
AfDB President rounds up Asian tour in Beijing with firm commitments for support (AfDB)
Most of the cooperation commitments discussed at the meetings will be concretized at the Bank’s 2016 Annual Meetings in Lusaka, Zambia. The Bank’s staff involved in Japan, Korea and China will be very activate in the coming days refreshing MOUs and writing the terms of new cooperation agreements, a member of the delegation said.
African Institute for Economic Development and Planning: progress report (UNECA)
Now that the strategic framework has been defined globally, time has come for an contextualized action in 2016, to translate these agenda into national, subregional and regional objectives. IDEP will therefore reorganize itself in order to adapt its offer to a changing environment and - as previously - pursue its support to member States in setting up training programmes in full compliance with the requirements of their transformative agenda.
Training of trade counsellors from IGAD livestock exporting countries to GCC countries (IGAD)
The IGAD Centre for Pastoral Areas and Livestock Development, in collaboration with FAO SFE, organized the training of trade counselors in Addis Ababa, 21-24 March. The activity was funded by an Italian-funded project. The limited exports has partly been due to limited coordination between the trade counsellors, exporters and chief veterinary officers. The gap has been in terms of real time market information and dissemination on import requirements as well as commodity prices and limited promotional and linkage efforts. The workshop made the following recommendations: [Zuma consolidates ties in the Gulf region (IOL)]
Nigeria: trade diplomacy, foreign policy perspectives (Daily Trust)
Q to Minister of Foreign Affairs, Geoffrey Onyeama: After one year, what should Nigerians expect from the ministry? 'We are faced with severe economic challenges. What can we, as a ministry, do? We decided on economic diplomacy as the framework in which we want to operate. We have identified two areas. First, we are looking at a strategy of targeting a number of African countries to have with them an agreement for the free movement of business people within Africa in order to enlarge the economic space for Nigerian businessmen. The second is to develop a matchmaking data base where Nigerian business persons can upload information about themselves, businesses and what they want to sell to the world and this would be accessible through our 119 foreign missions.'
Nigeria's promise turns to peril as investors head for the exits (Bloomberg)
Nigeria’s appeal has faded as the price of oil, source of 90% of export earnings, has crashed. Growth slumped to 2.8% last year, the slowest since 1999, and will decelerate to 2% in 2016, according to Morgan Stanley. In dollar terms, the economy in 2019 will still be 17% smaller than its 2014 peak of $542bn. Only two years ago, McKinsey & Co. said Nigeria had the potential to grow 7.1% annually until 2030 and build a $1.6trn economy. [Nigerian lawmakers want wireless giant MTN's fine doubled to eye-popping $10bn (M&G Africa)]
Total readies Shs13 trillion for oil pipeline development (Daily Monitor)
French oil major Total S.A has said it will finance the development of the $4b (Shs13 trillion) crude oil export pipeline from Uganda’s Albertine Graben to Tanzania’s Tanga port at the Indian Ocean. Mr Javier Rielo, the Total East Africa vice president, on Monday, assured Tanzanian President John Magufuli that “the company will begin construction of the pipeline project to transport oil from Uganda to Tanga as soon as possible, for funds to implement the project exist.”
Is the WTO a World Tax Organization? A primer for WTO rules for policy makers (IMF)
This paper examines the extent to which World Trade Organization rules impinge on policy makers’ freedom to formulate tax policies. It provides an overview of both the economic rationale for WTO rules concerning taxation and the provisions of the main WTO agreements concerning border taxes and internal taxes (direct as well as indirect). It also points out some tax anomalies and inconsistencies in these rules, and how the rules have evolved as a consequence of the interpretation of the WTO agreements by its Dispute Settlement Body and the latter’s rulings in connection with several disputes over taxes affecting trade. [The author: Michael Daly]
International regulatory co-operation: the role of international organisations (OECD)
In order to strengthen the information base on this topic and shed light on the contribution of IOs to IRC, the OECD carried out in 2015 a survey covering the governance, operational modalities and tools of IOs, as well as their rule-making disciplines and assessment of implementation and impacts. For most IOs, the main benefits provided by their IRC activities come from increased transparency of regulatory frameworks, knowledge flow and peer learning through exchange of information. Secondly, they promote efficiency gains and reduction of regulatory burdens through the sharing of tasks and increased coherence across regulatory requirements. The economic benefits, such as reducing regulatory burden or fostering economies of scale, come last.
Local nexus and jurisdictional thresholds in merger control (OECD)
Background paper by the Secretariat: Three years later, this paper seeks to provide a detailed overview of merger control thresholds and local nexus criteria in various countries, and to compare them with international recommendations on the topic. The paper is structured as follows: chapter 2 will provide some background on the topic of merger control thresholds and local nexus criteria; chapter 3 will describe the various types of notification thresholds and local nexus criteria adopted in different countries; chapter 4 will compare current practices to international guidelines, and identify the main developments since the Recommendation was adopted in 2005; and, finally, chapter 5 will summarise and analyse the main findings. [Annex to the Background Paper]
Related: Best practice roundtables on competition policy: June 2016, OECD, Public interest considerations in merger control: background paper
Over-The-Top (OTT) Services and regulation (tralac)
A close connection is developing between the rules of international trade on market access, domestic regulation and network neutrality. This is increasingly subject to trade negotiations. However, a comprehensive classification of the different facets of OTT services is yet to be developed. [The author: JB Cronje]
Going beyond goods: measuring services for export competiveness (World Bank)
Many governments are interested in how services support their country’s exports and economy at large. Answers to such questions are typically left unanswered because systematic data is not readily available on how services contribute to exports across developing countries and sectors. The Export of Value Added Database was developed to fulfill this need. What sets the EVA Database apart is the wide coverage of developing countries: over 70 of the economies included are low- and middle-income.
Egypt, World Bank sign $5m grant to ease regulatory environment for investors (World Bank)
Asian Development Outlook 2016 (ADB)
Growth is slowing across much of developing Asia as a result of the continued weak recovery in major industrial economies and softer growth prospects for the People’s Republic of China (PRC). This will combine to push growth in developing Asia for 2015 and 2016 below previous projections, says a new Asian Development Bank report. In its new Asian Development Outlook (ADO) 2016, ADB forecasts GDP growth of 5.7% in 2016 and 2017 for the region. In 2015, GDP growth was 5.9%. ADO is ADB’s flagship annual economic publication. [Downloads]
Related, regional perspectives: The benefits of regional electricity cooperation and trade: lessons from South Asia (World Bank), ADB, JICA establish $1.5bn fund to invest in private infrastructure (ADB), With RCEP commitment, India marks big shift in trade policy (Livemint), Roberto Azevêdo speech: 'Brazil in the global trading system: achievements and future challenges' (WTO), DG Azevêdo welcomes Brazil’s ratification of WTO trade facilitation deal (WTO)
Swaziland has to borrow $422.1m - official (StarAfrica)
Challenges for EAC to phase out 'Caguwa' by 2019 (New Times)
Mozambique/Swaziland: new bridge to boost trade (StarAfrica)
Tanzania: Ruvu gas find could be worth up to $11bn (IPPMedia)
East Africa: 'Chambers can issue Certificates of Origin' (editorial comment, East Africa Business Week)
Oil prices and the global economy: it’s complicated (IMF)
London Stock Exchange launches Africa Advisory Group to boost African capital market development
GREAT Insights: Partnerships with business for development (ECDPM)
tralac’s Daily News archive
Catch up on tralac’s daily news selections by following this link ».
SUBSCRIBE
To receive the link to tralac’s Daily News Selection via email, click here to subscribe.
This post has been sourced on behalf of tralac and disseminated to enhance trade policy knowledge and debate. It is distributed to over 350 recipients across Africa and internationally, serving in the AU, RECS, national government trade departments and research and development agencies. Your feedback is most welcome. Any suggestions that our recipients might have of items for inclusion are most welcome.
Related News


tralac in the news ~ African countries should diversify exports to adapt to changes in China
The ongoing changes in China’s economy may be an opportunity for African countries that now mainly export raw materials and oil, to adapt and diversify exports and move up the value chain, according to analysts.
China, Africa’s main trading partner, has registered an economic slowdown and the authorities want the “engine” of growth in the coming years to be domestic consumption rather than investment, which will affect external demand, particularly in sub-Saharan Africa, according to an analysis by the Trade Law Centre for Southern Africa (tralac).
“As Chinese domestic demand changes from investment goods for domestic consumption and, implicitly, to services, exporters of food and services can gain from the change,” said the March analysis of the China Africa Trading Relationship.
This will offset the impact of reduced demand for African imports and the fall in commodity prices, which will have a negative impact on global prices of such goods, affecting the terms of trade.
“It is therefore imperative for African countries to diversify exports and move up the value chain,” says the document.
Angola, for which oil is the main export and the basis of its economy, is among the countries where efforts to diversify exports are most visible, following the fall in revenue related to the oil price drop since mid 2014.
The increase of Chinese trade with Africa – to USD221.5 billion in 2014, more than 20 times that recorded in 2001 – was driven “by the large bill on oil imports, mainly from Angola,” the Trade and Law Center said.
Figures from UN Comtrade (United Nations Commodity Trade Statistics Database) for 2014 put Angola as the second largest source of Chinese imports in Africa, with 27 percent of the total, behind South Africa (39 percent), and 5th largest destination for exports with 6 percent.
After the last Forum on China-Africa Cooperation (Johannesburg, 4-5 December 2015), economist Mark Bohlund in an article for Bloomberg Intelligence, noted that the slowdown in China would be another “jolt” for African countries.
The fall in oil prices, he argues, is more of a result of increased production in the United States than a reduction of imports by China – whose economy continues to grow, from a higher base.
The drop in investment levels, he said, mainly reflects the devaluation of some mining assets and “investment financed by debt is much more important for Africa than FDI and should continue to grow as China expands the scope of projects financed in Africa.”
“Chinese investment in infrastructure in sub-Saharan Africa is more likely to increase than decrease,” taking into account the Chinese central bank’s transfers to the Export Import Bank of China ($45 billion) and the China Development Bank ($48 billion) in July 2015 to finance the New Silk Road strategy, said Bohlund.
The Chinese authorities have been arguing that even in the current context of slowdown, Africa investment and will continue and even become more important.
Li Yifan, the Chinese Ambassador to Ethiopia told the Reuters news agency on 15 March that African countries may even be “the ideal place” for business investment of companies that “have driven the expansion of Chinese infrastructure in the last 30 years,” at a time when the domestic economy is slowing and they are increasingly looking to foreign markets.
“Despite all the doubts, I can share that in China the relevant government departments, development banks, and insurance companies are addressing their African partners to make this great plan a reality,” said Li.
» Read the China Africa Trading Relationship, March 2016 update
Related News


Is the WTO a World Tax Organization? A primer for WTO rules for policy makers
This paper examines the extent to which World Trade Organization (WTO) rules impinge on policymakers’ freedom to formulate tax policies. It provides an overview of both the economic rationale for WTO rules concerning taxation and the provisions of the main WTO agreements concerning border taxes and internal taxes (direct as well as indirect).
It also points out some tax anomalies and inconsistencies in these rules, and how the rules have evolved as a consequence of the interpretation of the WTO agreements by its Dispute Settlement Body and the latter’s rulings in connection with several disputes over taxes affecting trade.
As WTO Members will undoubtedly want to avoid having their tax policies successfully challenged in the WTO, the paper provides some guidance concerning the design of tax policy.
Introduction
Despite more than six decades of multilateral trade liberalization unleashed by the General Agreement on Tariffs and Trade (GATT) in 1947, protectionist policies persist in many international goods markets. Perhaps the greatest challenge regarding the design of multilateral trade rules is the concern that trade liberalization commitments with respect to one policy instrument, such as tariffs, may be vitiated by other protectionist instruments unconstrained by such rules. Consequently, multilateral trade and other agreements must address a wide range of potentially protective measures, including tax measures other than tariffs.
Tariffs and other indirect taxes, whether levied at the border or internally, have long been subject to the binding multilateral rules embodied in the GATT. However, in recognition of the fact that tax measures can be used as substitutes for other types of protection and government assistance or regulation, direct as well as indirect taxes have come under increased scrutiny at the World Trade Organization (WTO). This recognition is reflected in several of the agreements negotiated under the Uruguay Round, notably those concerning subsidies and trade-related investment measures (TRIMs). These agreements reflect the realization by national governments that multilateral rules need to play an increasingly important role in regulating the use of tax as well as non-tax measures, especially where these measures affect the international movement of goods, services, capital, technology and persons.
As a consequence of these agreements, the range of tax measures challenged by WTO Members has widened considerably beyond the more traditional trade taxes. Since 1995, taxation has been the cause of over 40 of the 500 disputes that have been initiated with Members’ requests for consultations submitted to the WTO’s Dispute Settlement Body (DSB), which is now arguably the world’s most prolific international dispute resolution system. Roughly half of these disputes have resulted in the establishment of panels and consequent rulings by the DSB. The DSB’s rulings against Indonesia’s National Car Programme and especially against the United States concerning the latter’s Foreign Sales Corporation (FSC) scheme, which, at the time, led to the largest retaliation award ever authorized in a dispute at the WTO, are particularly noteworthy. These rulings confirmed, if there were ever any doubt, that, generally speaking, direct as well as indirect taxes (including, of course, not only tariffs), are subject to WTO rules, notwithstanding efforts by tax authorities to secure specific exemptions for certain direct tax measures in these agreements. The FSC ruling also reconfirmed the traditional distinction under multilateral trade rules between direct and indirect taxes, especially with respect to how such taxes should be treated under the border tax adjustment and subsidy rules of the WTO. It would not be surprising if other WTO-inconsistent tax measures were identified in the future, leading to further disputes among WTO Members. WTO rules can therefore be expected to continue to be an important factor in shaping tax policies, as Members will undoubtedly want to avoid having their tax policies successfully challenged in the WTO.
This paper provides an overview of the extent to which taxation is subject to WTO rules, which embody the fundamental principles of non-discrimination, predictability and transparency. Section II provides a synopsis of the possible economic rationale for these principles (and thus the main provisions of the GATT/WTO agreements), which can be ignored by readers already familiar with the basic theory of trade policy instruments. Section III focuses attention on the basic rules of the GATT/WTO agreements as well as several other provisions that are especially relevant for tax policymakers. Section IV examines how these rules have been interpreted by the DSB in a few selected cases concerning tax measures. Section V contains some concluding remarks. The Annex provides some guidelines concerning WTO rules for tax policymakers.
Economic Rationale for WTO Rules
Before providing an overview of the extent to which GATT/WTO rules encompass taxation, this section considers the possible economic rationale for the main rules and their underlying principles, namely non-discrimination, predictability and transparency. The broad aim of these rules is to regulate, if not remove, distortions to trade. These distortions contribute to economic inefficiency, by, for example, reducing consumer choice, raising prices to consumers, including downstream processors, and disrupting global supply chains, thus impeding economic development. Attention here is focused mainly on the GATT because the fundamental principles and consequent obligations embodied in this agreement form the basis for the other WTO agreements, such as the General Agreement on Trade in Services (GATS). In some respects, however, WTO tax rules appear to be anomalous or, indeed, inconsistent with economic theory concerning trade taxation.
Notwithstanding the considerable progress made in dismantling barriers to trade as a result of multilateral negotiations under the auspices of the GATT/WTO, protectionist policy measures are still widely used by WTO Members for various reasons, compelling or not. These may include: shifting the terms-of-trade in a country’s favour; protection of specific domestic “infant” industries; correction of “market failure”; conservation of natural resources; assistance to downstream processing of such resources; food security; or as a counterbalance to domestic or other countries’ trade distortions (in accordance with the theory of Second Best). In some mainly developing countries, they are also still an important source of tax revenues. Among the various protectionist measures available concerning trade in goods are tariffs (non-discriminatory or discriminatory), quantitative restrictions (quotas), voluntary export restraints, export taxes, discriminatory tax policies, and subsidies, including tax incentives. Some of these (and other measures) may have similar or equivalent economic effects, particularly concerning their deadweight efficiency losses, while others can have very different effects. There may also be inherent similarities or differences concerning their transparency, predictability, susceptibility to rent-seeking, ease of administration, etc.
The rest of this section provides an analysis of these non-tariff measures in comparison with a tariff, irrespective of whether government intervention to restrain trade makes economic sense or not. It also highlights some well-known instances of economic equivalence as regards different measures. At the same time, it identifies protectionist tax policy measures that do the least damage. After all, damage limitation is often a major challenge for tax, if not other, policymakers. In doing so, it is shown that, by and large, WTO rules do encourage “efficient protection,” particularly as far as goods markets are concerned (Sykes, 2001). A comparison of tax measures suggests that non-discriminatory tariffs and domestic subsidies, including those in the form of tax relief, tend to involve relatively “efficient protection” and that these measures are less constrained by WTO rules. More damaging forms of protection are, to a large degree, discouraged, if not prohibited.
This material was prepared at the request of the IMF; Mr. Daly is a member of a panel of fiscal experts advising the IMF’s Fiscal Affairs Department. The analysis and policy considerations expressed in this publication are those of a member of the author and do not necessarily represent the views of the IMF, its Executive Board, or IMF management.
Related News


Oil prices and the global economy: It’s complicated
Oil prices have been persistently low for well over a year and a half now, but as the April 2016 World Economic Outlook will document, the widely anticipated “shot in the arm” for the global economy has yet to materialize. We argue that, paradoxically, global benefits from low prices will likely appear only after prices have recovered somewhat, and advanced economies have made more progress surmounting the current low interest rate environment.
Since June 2014 oil prices have dropped about 65 percent in U.S. dollar terms (about $70) as growth has progressively slowed across a broad range of countries. Even taking into account the 20 percent dollar appreciation during this period (in nominal effective terms), the decline in oil prices in local currency has been on average over $60. This outcome has puzzled many observers including us at the Fund, who had believed that oil-price declines would be a net plus for the world economy, obviously hurting exporters but delivering more-than-offsetting gains to importers. The key assumption behind that belief is a specific difference in saving behavior between oil importers and oil exporters: consumers in oil importing regions such as Europe have a higher marginal propensity to consume out of income than those in exporters such as Saudi Arabia.
World equity markets have clearly not subscribed to this theory. Over the past six months or more, equity markets have tended to fall when oil prices fall – not what we would expect if lower oil prices help the world economy on balance. Indeed, since August 2015 the simple correlation between equity and oil prices has not only been positive (Chart 1), it has doubled in comparison to an earlier period starting in August 2014 (though not to an unprecedented level).

Past episodes of sharp changes in oil prices have tended to have visible countercyclical effects – for example, slower world growth after big increases. Is this time different? Several factors affect the relation between oil prices and growth, but we will argue that a big difference from previous episodes is that many advanced economies have nominal interest rates at or near zero.
Supply versus demand
One obvious problem in predicting the effects of oil-price movements is that a fall in the world price can result either from an increase in global supply or a decrease in global demand. But in the latter case, we would expect to see exactly the same pattern as in recent quarters – falling prices accompanied by slowing global growth, with lower oil prices cushioning, but likely not reversing, the growth slowdown.
Slowing demand is no doubt part of the story, but the evidence suggests that increased supply is at least as important. More generally, oil supply has been strong owing to record high output from members of the Organization of the Petroleum Exporting Countries (OPEC) including, now, exports from Iran, as well as from some non-OPEC countries. In addition, the U.S. supply of shale oil initially proved surprisingly resilient in the face of lower prices. Chart 2 shows how OPEC output has recently continued to grow as prices have fallen, unlike in some previous cycles.

Moreover, even in the United States, a net oil importer where demand has been fairly strong, cheap oil seems not to have given a substantial fillip to growth. Econometric and other studies suggest that only part of the recent decline in oil is due to slowing demand – somewhere between a half and a third – with the balance accounted for by increasing supply.
So there remains a puzzle: where in the world can the positive effects of lower oil prices be seen?
To address this question, the forthcoming April 2016 World Economic Outlook compares 2015 domestic demand growth in oil importers and oil exporters to what we expected in April 2015 – after the first substantial decline in oil prices. The lion’s share of the downward revision for global demand comes from oil exporters – despite their relatively small share of global GDP (about 12 percent). But domestic demand in oil importers was also no better than we had forecast, despite a fall in oil prices that was bigger than anticipated.
Understanding why the naked eye cannot detect positive spending effects requires a closer look at the composition of demand in oil exporters and importers.
Domestic demand in oil exporters
In 2015, domestic demand in oil exporters was indeed much weaker than we had forecast a year before. This negative surprise reflected both weaker consumption and especially weaker investment. Rich oil exporters can draw on their reserves or sovereign wealth funds, and most of them have, but they have also been cutting government spending sharply. Poorer countries, of course, have much lower borrowing capacity, and risk crises if foreign debt levels get too high. Most have sharply lower current account surpluses or higher deficits, and their sovereign spreads have risen. In these countries domestic spending can fall sharply, in a nonlinear fashion – sometimes through the impact of large exchange rate depreciations that make imported goods more expensive. Public investment has fallen especially fast – most capital goods are imported, and when fiscal adjustment is needed, capital spending is typically the first item to be cut. And of course, factors unrelated to oil prices have also being weighing on economic activity in a number of oil exporters – ranging from domestic strife in Iraq, Libya, and Yemen to sanctions in Russia.
Of course, low oil prices make exploration and extraction activities less profitable in the private sector, leading to lower capital expenditures there as well. According to Rystad Energy, the fall in global capital expenditure in the oil and gas sector amounted to about $215 billion between 2014 and 2015 – about 1.2 percent of global fixed capital formation (or just below 0.3 percent of global GDP). Even some oil importers have been hit hard, notably the United States, which accounts for a significant part of the global drop in energy-related investment.
Domestic demand in oil importers
Advanced oil importing economies have indeed seen some positive effects on consumption – for instance, in the euro area – but the impact has been somewhat less than anticipated. And investment growth has fallen short of expectations – also reflecting the unexpectedly large decline in U.S. energy-related investment mentioned above. The situation for oil importers in the emerging and developing world is varied. These countries typically have more limited pass-through from international to domestic fuel prices compared with advanced economies; some have reduced fuel subsidies. True, governments’ improved fiscal positions should eventually result in lower taxes or increased public spending, but the process could take time and is subject to various frictions and leakages. Overall, domestic demand growth for these oil importers was broadly in line with expectations – despite difficult macroeconomic conditions in a few countries that are exporters of other commodities.
Surprising macroeconomics at the zero interest-rate bound
There is another factor potentially impeding a pickup of demand in oil importers.
Compared with previous price cycles, falling oil prices this time coincide with a period of slow economic growth – so slow that the major central banks have little or no capacity to lower their monetary policy interest rates further to support growth and combat deflationary pressures.
Why does this matter? In the 1970s and 1980s, a large economics literature, summarized by Michael Bruno and Jeffrey Sachs more than three decades ago, showed how oil-supply-driven price increases lead to stagflation – a combination of higher inflation and slower growth. Stagflation is a direct result of higher costs for producers who use energy, costs that lead them to reduce output, shed labor, and raise prices to cover higher costs.
Even though oil is a less important production input than it was three decades ago, that reasoning should work in reverse when oil prices fall, leading to lower production costs, more hiring, and reduced inflation. But this channel causes a problem when central banks cannot lower interest rates. Because the policy interest rate cannot fall further, the decline in inflation (actual and expected) owing to lower production costs raises the real rate of interest, compressing demand and very possibly stifling any increase in output and employment. Indeed, those aggregates may both actually fall. Something like this may be going on at the present time in some economies. Chart 3 is suggestive of a depressing effect of low expected oil prices on expected inflation: it shows the strong recent direct relationship between U.S. oil futures prices and a market-based measure of long-term inflation expectations.

Being near the zero bound also can imply a “perverse” response to higher oil prices. When central banks are battling deflation pressures, they are unlikely to raise policy interest rates aggressively to counter an uptick in inflation. As a result, oil price increases, symmetrically, can be expansionary by lowering the real interest rate.
Of course, it would be wrong to conclude that central banks can enhance the benefits of current low oil prices by raising their policy interest rates. On the contrary, all else equal, that action would harm growth by raising real interest rates. Our claim is simply that when an oil importer’s macroeconomic conditions warrant a very low central bank interest rate, a fall in oil prices could move the real interest rate in a way that runs counter to the positive income effect.
The way forward
Persistently low oil prices complicate the conduct of monetary policy, risking further inroads by unanchored inflation expectations. What is more, the current episode of historically low oil prices could ignite a variety of dislocations including corporate and sovereign defaults, dislocations that can feed back into already jittery financial markets. The possibility of such negative feedback loops makes demand support by the global community – along with a range of country-specific structural and financial-sector reforms – all the more urgent.
Related News


Crude pipeline confusion strains Kenya-Tanzania ties
A rift between Kenya and Tanzania could widen following Uganda’s indecisive position on the $4 billion crude oil pipeline.
A week before the meeting between Uganda’s President Yoweri Museveni and President Uhuru Kenyatta, energy officials from Uganda held parallel meetings on the matter with Tanzanians and Kenyans.
Kenya and Uganda officials held a week-long meeting at Laico Regency, Nairobi, under the Northern Corridor Integration Projects while Tanzanian energy officials met with their Ugandan counterparts in Kampala.
The two parallel meetings were held before the presidential meeting to ascertain the level of preparedness by either Tanzania or Kenya on the crude oil pipeline.
Kenyan and Ugandan officials led by President Museveni and Kenyatta then met at Kenya’s State House Monday last week to finalise the talks.
Frances’ Total, UK’s Tullow Oil and China’s CNOOC were part of the meeting, sending strong signals for the Hoima-Lokichar-Lamu route.
“President Uhuru Kenyatta today held fruitful discussions with Uganda’s President Yoweri Museveni on the regional East Africa crude oil pipeline,” said a statement signed by Energy minister Charles Keter and his Uganda’s counterpart Irene Muloni.
Tanzania’s President John Pombe Magufuli, however, was not pleased with the proceedings of the Kenya-Uganda meeting. He demonstrated his frustration last week Wednesday by holding diplomatic passports of Kenyan energy officials, denying them entry into the Port of Tanga.
The team was on a tour to the Tanga Port acting on the presidential order to have all three ports – Tanga, Mombasa and Lamu – compared technically to inform in the final decision making.
Mr Keter and Petroleum PS Andrew Kamau, his Energy counterpart, Mr Joseph Njoroge and The Lamu Port Southern Sudan-Ethiopia Transport (Lapsset) corridor CEO Sylvester Kasuku are the Kenyan crew denied entry into Tanga.
Passport
“We had earlier made officials communications to Tanzanian foreign affairs of our visit and were granted access,” said an official privy to the ordeal.
“Things changed when we were received at the airport by government officials. Passports were submitted for clearance and took too long to come back. President Magufuli had given orders not to allow us in though our Ugandan counterparts went through.”
“We are basically captives here. They have refused to give us back our passports for about one hour. They have also refused us entry into the Port of Tanga,” PS Kamau had earlier told the Smart Company in a telephone interview.
Tanzania Petroleum Development Corporation (TPDC) Executive Director James Mataragio, also recently announced that France had set aside $4 billion to begin construction of the Tanga pipeline by August and have it completed in two years.
“It is anticipated that over 200,000 tonnes of bare pipes, materials and equipment such as pipe insulation, pump, bulk heating and trace heating stations will be imported through Tanga port,” Mr Mataragio is quoted by Tanzania’s publication The Citizen.
Talks on the pipeline taking the Kenyan route are back on track and could be sealed soon, causing a blow to Tanzania.
Kenya together with Uganda is currently on a quest to settle on the least cost option for a regional integrated pipeline. Next week, the two countries will travel through Lamu to compare the infrastructure, terrain and elevations on the route with the Eldoret-Mombasa route and the Uganda-Tanga route. Tanzania officials have been invited for the tour.
Museveni and Kenyatta will thereafter in early April meet at the Northern Corridor Integration Projects Summit in Kampala with the view of settling on the prolonged $4billion crude oil pipeline route.
Ongoing discussions could thwart a deal mooted in October to have the crude oil pipeline constructed through Tanga. Uganda is bound to Tanzania by a MoU initiating a study on the Tanga route.
Further, this could worsen the shaky relationship between Tanzania and Kenya both in terms of trade and project relations. Tanzania-Kenya trade has not been at its peak with the former being accused of putting non-trade barriers on Kenyans including delay of work permits.
Data by the Kenya National Bureau of Statistics (KNBS) in February states that Tanzania cut its imports from Kenya last year by Sh8 billion to Sh25.3 billion, signaling the worsening relationship between the two countries.
Uganda on the other hand is the largest buyer of Kenyan goods with imports standing at Sh60 billion by February. While Tanzania has not embraced the integration spirit in infrastructure projects along the Northern Corridor (where crude oil pipeline is a major project) Uganda is part of the bloc which consists of five members.
Related News


New trade deals challenge Africa to step on to the global stage
Without growing its economy, Africa risks being left behind, unable to create the jobs it needs to reduce poverty
Africa needs to grow its economy in order to reduce poverty and create jobs for the millions who will be entering the workforce. In the development community, this statement has become almost trite.
But is it the whole truth? After decades of underperformance, Africa had economic growth rates of 5.8% from 2004 to 2014, democracy is now the norm rather than the exception, and corruption is being tackled as the rule-of-law has been strengthened in several countries.
By 2030 sub-Saharan Africa could be adding more working-age people to the global labour force than the rest of the world combined. If jobs can be created, then this demographic transition alone could raise GDP per capita by a further 50% by 2050.
Still, many challenges threaten to reverse this progress. Responding to them will require Africa to diversify its economy and better integrate into the global economy. And this will mean bringing Africa into the new systems of international trade that are being negotiated.
Over the last 18 months many of the key drivers of Africa’s growth have changed. Commodity prices have collapsed, contracting government budgets and export income. China – Africa’s largest trading partner – is slowing, perhaps by a lot. And the easy monetary policy in the US, which drove cheap capital into investments in Africa, is at an end. As a result, GDP in Africa in 2015 slowed to around 4.5% – not bad considering the anaemic growth in most of the world, but significantly lower than Africa needs.
To reduce poverty further and create jobs, Africa will need to become more globally engaged.
As has been seen with the remarkable growth in Asia over the last 30 years, trade openness supports export-orientated manufacturing sectors, which absorb large numbers of low-skilled labourers. There are also opportunities for Africa to expand agriculture exports, a sector responsible for 65% (pdf) of jobs in sub-Saharan Africa, half of which are held by women.
Yet international trade is an area where Africa underperforms.
For instance, in 2014 the share of global exports from sub-Saharan Africa was less than 2%. And this poor performance was despite African business having preferential market access into the United States and the European Union.
Sub-Saharan Africa is also poorly integrated into global supply chains where businesses can contribute inputs into the creation of final products. More than half of world trade is now in intermediate goods. And plugging into these global networks avoids having to develop entire industries from scratch.
But there are also new rules.
While Africa needs to become part of the global economy, the rules of engagement are changing in ways that could further marginalise Africa. This is primarily the result of a US-led push to develop new high-standard trade and investment agreements – the most significant of these being the Trans-Pacific Partnership agreement concluded last October. In addition, the US and the EU are negotiating a bilateral trade deal and there are other large trade negotiations centred in Asia.
No country in Africa is a part of these new trade agreements; yet they will significantly affect Africa’s ability to participate in the global economy. As tariffs come down, the value to African businesses of tariff-free access to the US market will be reduced. These agreements also include new rules on labour and environment standards that African businesses are likely to find difficult to meet, further affecting participation in global supply chains.
At the same time, no progress is being achieved on completing the global trade negotiations at the World Trade Organisation. This means that there is currently no large global trade negotiation where Africa’s views are being considered.
The risk is that Africa will find it increasingly difficult to compete globally, confining the continent to a shrinking share of international trade and diminishing its attractiveness as a destination for investment, undermining growth, and job prospects.
These challenges underscore the need for leaders, businesses, and civil society in Africa, and globally, to ensure that Africa is not left behind. Progress here could be the difference between a prosperous Africa and a slowly declining, less stable continent, with global repercussions.
Joshua P Meltzer is a senior fellow in global economy and development at the Brookings Institution
Related News


21st Meeting of the COMESA Committee of Governors of Central Banks: Challenges of dollarization in COMESA
The 21st Meeting of the COMESA Committee of Governors of Central Banks was held from 18-19 November 2015 in Lusaka, Zambia. Governors reviewed the activities that were undertaken by COMESA Monetary Institute (CMI) and the COMESA Clearing House for enhancing monetary cooperation in the region and endorsed a 2016 Work Plan for the two COMESA institutions.
The Secretary General of COMESA, in his statement, emphasized that monetary cooperation programmes at the regional level are building blocks for achievement of continental integration. He, therefore, proposed to make monetary cooperation as a Tripartite (COMESA, EAC and SADC) agenda for speeding up continental integration which is currently being pursued by the Association of African Central Banks (AACB). This he said will avoid duplication of efforts due to overlapping membership. He also emphasized the importance of the region’s involvement in supranational and global value chains as well as international production aimed at high value products that can access global markets.
He pointed out that industrialization can diversify the region’s dependence on commodity trade and emphasized the importance of collective thoughts to come up with a good industrialization policy for the region. He underscored the importance of prudent fiscal policies and financial intermediation for making the region a zone of macroeconomic stability and enhancing integration. He stated that the speedy implementation of the Regional Payment and Settlement System (REPSS) will significantly contribute to the expansion of intra-COMESA trade. He, therefore, urged all member Central Banks to expeditiously use REPSS for payment for their intra-COMESA transactions.
Report of the 13th Meeting of the Monetary and Exchange Rates Policies Sub-Committee
The Effects of Fiscal Policy on the Conduct and Transmission Mechanism of Monetary Policy
Governors were informed that research papers were prepared by experts from Central Banks of Burundi, Egypt, Kenya, Malawi, Mauritius, Rwanda, Swaziland, Sudan, Uganda, Zambia and Zimbabwe. The papers focused on the following:
-
Key features of the operational framework for fiscal and monetary policy and interaction between fiscal and monetary policies;
-
Theoretical and empirical literature on the different channels through which fiscal policy can affect monetary policy;
-
Trends in fiscal performance including trends on dependence on foreign borrowing and grants;
-
Review of existing legal and institutional development which are necessary in order to avoid fiscal dominance and to ensure effective coordination of monetary and fiscal policies;
-
Challenges facing the existing fiscal policy regime;
-
Empirical analysis of the channels in which fiscal policy affects monetary policy; and
-
Recommendations.
Governors noted the following salient features of the research papers:
Key features of Fiscal and Monetary Policies in COMESA member countries in recent years
Governors were informed that the following are key features of fiscal policy in selected countries:
-
Many countries introduced Public Finance Management System (PFM). PFMs require that the budget is comprehensive by including all financial operations of the Government. Thus both the current and capital budget should be included under one budget and aid and debt, as well as other off-budget items (including contingent) must be captured in the budget. Such a comprehensive sweep of the budget would facilitate coordinating fiscal policies within a macroeconomic policy framework and enable assessment of the sustainability of fiscal policies over the short and medium term. Having a robust PFM by member countries is one of the requirements of the COMESA Multilateral Fiscal Surveillance Framework.
-
Many Member countries are making significant progress in preparing their budgetary policies within a comprehensive medium term financial management framework, comprising a set of four separate frameworks: A Medium Term Fiscal Framework (MTFF), a Medium Term Budget Framework (MTBF) and Medium Term Expenditure Framework (MTEF). The COMESA Multilateral Fiscal Surveillance Framework is based on the availability of all the four components of the Medium Term Financial Management Framework. However, their development in member countries is constrained due to insufficient availability of data, and capacity for data analysis which could only be built from the medium to long run.
-
The institutions and laws governing fiscal policy are enshrined in legislation and often derived from constitution.
-
All countries have legal systems that define functions and responsibilities of the Ministry of Finance in the country’s debt management process. This also specifies the limit of indebtedness and guarantees that the country can undertake. This strengthens fiscal discipline in the country and ensures that the country remain on a prudent fiscal path.
-
Many member countries undertook the following tax reforms:
-
Significant attempt has been made by most member countries to reduce reliance on the taxation of international trade and to shift the tax system toward domestic transactions and sources of income.
-
VAT was introduced in almost all member countries. Tax reforms have also been instrumental in shifting excises from a specific to an advalorem valuation basis.
-
Almost all countries have simplified and improved the equity and efficiency of their personal income taxes by scaling down the highest marginal rates, reducing the number of rates, and reducing exemptions and deductions.
-
Tax administration in almost all countries has improved through better training and salaries and conditions of service for revenue collection personnel. Special emphasis was placed on providing adequate trained manpower and other infrastructural facilities to enable the attainment of revenue potential.
-
-
Some countries use countercyclical interventions when the economy is below or above potential growth path. Countercyclical expenditures involves increasing public spending when the economy is growing below its long run potential, and decreasing it when output rises close to potential and is threatening to cause resource scarcities that provoke inflationary pressures.
Governors observed that the following are key features of monetary policy in selected member countries:
-
The overriding objective of monetary policy for most central banks is price stability. Other objectives pursued by many central banks in the region in recent years include financial stability and economic growth.
-
Most COMESA member countries removed exchange controls and adopted a more flexible exchange regime.
-
Most countries moved from direct to indirect monetary management. This includes establishment of open market operations for monetary policy purposes and to improve liquidity management. Some countries introduced framework for repurchase and reverse repurchase transactions. In some countries for example Mauritius, Key Repo Rate (KPR) acts as a policy rate to signal its monetary policy stance.
-
Many countries still use base money or reserve money as operational target in the conduct of monetary policy while broad money has been used as the intermediate target with inflation being the ultimate target.
-
Many countries are embarking on modernizing their monetary policy framework with the ultimate objective of adopting an inflation targeting monetary policy framework. Some countries have introduced policy rates. The motivations for modernizing the monetary policy regime are to enhance market participants understanding of the monetary policy stance and to strengthen the monetary policy transmission channel, particularly the interest rate channel.
-
Some countries like Mauritius, Kenya and Swaziland are making remarkable attempts on inflation targeting approach in the conduct of monetary policy.
-
Most central banks have Monetary Policy Committees with diverse membership.
Governors also noted that the following are direct and indirect channels through which fiscal policy affects monetary policy in selected countries:
-
Fiscal policy influences demand pressures and thus impacts inflation, via both direct spending by government and changes to private disposable income (through taxation and the benefit system). In particular, through the monetization of the fiscal deficits, fiscal policy undermines monetary policy as it fuels inflationary pressures. Even in the absence of monetization by the central bank, higher deficits may cause inflation, as the government’s borrowing requirements will increase the net credit demands, drive up interest rates and crowds out private investment. The resulting reduction in economic growth would lead to a decrease in the amount of goods available for a given level of cash balances, causing higher price levels;
-
Fiscal policy affects monetary policy directly through indirect taxes. If governments resort to substantial increases in indirect taxes-sales taxes, value added tax – this would have a direct impact on prices through the wage-price spiral;
-
Perceptions and expectations of huge budget deficits, and resulting large borrowing requirements are likely to trigger a lack of confidence in the economic prospects, posing risks to financial system stability;
-
On the external side, there are risks of too much dependence on foreign funding of domestic debt, arising from unsustainable fiscal deficit. This may result in exchange rate and/or balance of payment crisis which are worrisome to central banks;
-
Fiscal policy affects monetary policy through both domestic and public debt depending on its sustainability. If market participants perceive the growth in domestic/public debt as unsustainable, the credibility of the overall policy mix is reduced and interest rates will rise. Also, adverse shocks to external indebtedness tend to shift the long run interest rate spreads. Wider interest rates spreads lead to higher yields on government bonds and to higher commercial interest rates.
Challenges for Implementation of Fiscal and Monetary Policies
Governors observed that the following are some of the challenges for fiscal policy implementation in selected COMESA member countries:
-
Low level of private savings partly because of low income levels due to high levels of poverty.
-
A sizeable portion of most developing economies is non-monetized, rendering fiscal measures of the government ineffective and self-defeating.
-
External shocks on commodity prices such as oil, copper price shocks and external debt in most member countries affect the stance of fiscal policy.
-
In a number of countries, fiscal policy effectiveness is hindered by the difficulty to generate direct tax revenues; the inefficient collecting schemes of taxes; low rates of taxes on property; and a decline in taxes on international trade due to tariff reductions, trade agreements, and discretionary exemptions.
-
Lack of statistical information as regards the income, expenditure, savings, investment, employment etc. This makes it difficult for the public authorities to formulate a rational and effective fiscal policy.
-
Fiscal policy requires efficient administrative machinery to be successful. Most developing economies have corrupt and inefficient administrations that fail to implement the requisite measures vis-à-vis the implementation of fiscal policy.
-
Gaps in the legal and institutional framework governing fiscal policy in some countries.
-
Significant powers and responsibilities given to the Minister of Finance which could create fiscal dominance and thereby render monetary policy ineffective.
-
Huge external debt which result in serious repayment difficulties.
-
Huge increase in recurrent expenditure such as wages and salaries, interest payment on domestic debt, subsidies, grants and social benefits expenditure.
-
In some countries, the government crowds-out the private sector and distorts any investment and development prospects because of the limited financial resources.
Governors also noted that the following are some of the challenges of implementation of Monetary Policy in selected COMESA member countries:
-
For some countries, there is no central bank independence and there is lack of transparency in monetary policy conduct and implementation:
-
No publication of the discussion of the MPC and MPAC.
-
No provision for external membership in the MPC, and no provision for the publications of inflation forecasts to guide expectations.
-
The tenure of the governor and board members are not protected in constitution thereby creating vulnerability of the Banks’ independence.
-
-
In some countries, increased domestic borrowing has led to higher market lending rates and the crowding out of the private investment.
-
In some countries, currency outside banks or chronic excess liquidity posed serious challenges to the effectiveness of monetary policy.
Study on the Challenges of Dollarization to COMESA Member Countries
Governors noted the following definition and various facets of dollarization:
-
Dollarization occurs when a country adopts the currency of another as a legal tender (not necessarily restricted to the US Dollar). The domestic money is either replaced or used in parallel with the foreign currency.
-
There are various forms in which dollarization can happen, which include asset, liability, partial and full dollarization.
-
Official full dollarization occurs where a Government endorses, through political consensus, a foreign currency as having the exclusive status of legal tender in a country and abandons the use of its national currency.
-
With full dollarization, a country completely gives up control of monetary and exchange rate policy; and
-
Semi-official dollarization refers to a situation where both the local and the foreign currencies are used as legal tender.
Causes of Dollarization in COMESA region
-
Large macroeconomic imbalances and hyperinflation;
-
Financial repression and capital controls;
-
Underdeveloped financial markets – domestic borrowers contract debt in foreign currencies in response to the lack of domestic currency alternatives in incomplete financial markets.
Costs of dollarization
-
Immediate loss of monetary policy autonomy and the benefits of seigniorage (the profits accruing to the monetary authority from its right to issue currency – buy back “stock” of domestic currency or giving up future seigniorage earnings gained by issuer country unless there is agreements to share the same).
-
Country also lose the “exit option” to devalue in face of major exogenous shocks (Berg and Eduardo, 2000).
-
Dollarization also increases the susceptibility of the host country’s economy to shocks in the anchor country.
-
The Central Bank loses the lender of last resort function – Central banks lacks instruments to influence monetary aggregates and anchor private sector expectations of inflation.
-
Dollarization may lead to loss of political sovereignty.
-
For a country with a small export base, dollarization also leads to liquidity problems and hence lowers economic growth (Nota and Sakupwanya, 2013).
-
Liquidity risk – Sudden changes in investor and depositor perceptions about the health of the banking system may result in a deposit run and compromise international reserves holding.
-
Balance sheet risks – tend to arise in cases of partial dollarization. Banking sector vulnerabilities may be heightened because of direct exchange rate risks that result from currency mismatches in banks’ balance sheets.
-
The absence of monetary and exchange policy – may induce more volatility of GDP, and exposes the economy to shocks and other vulnerabilities that the Central Bank and Government are not able to offset.
-
Dollarization may disable the Central Bank and Government to issue domestic financial instruments, resulting in limited money market and inter-bank trading activities.
-
Under dollarization, the flexibility to use exchange and monetary policy is limited, and with it also, the inability of authorities to implement counter-cyclical measures.
Benefits of Dollarization
-
Dollarization being an irreversible institutional change leads to lower inflation, fiscal responsibility and transparency.
-
Reduces country risk premium on foreign borrowing, obtaining lower interest rates and leads to higher investment.
-
Inability of the Central Bank to embark on expansionary monetary policies also bestows a measure of confidence in the economy, thereby helping to lock away damaging and often self-fulfilling inflation expectations.
-
The absence of currency risk helps to eliminate externally induced banking and financial crises.
-
The absence of seignorage induces more fiscal discipline, while the absence of a lender of last resort induces banks to seek for alternative contingent funds. This gives a competitive edge to international banks over domestic banks inducing a more stable international banking system.
-
Dollarization makes economic integration easier, establishes a firm basis for a sound financial sector and thus promote strong and steady economic growth.
-
Dollarization also bring about a closer integration in financial markets
-
Dollarization avoids currency and balance of payments crises. Without a domestic currency there is no possibility of a sharp depreciation, or of sudden capital outflows motivated by fears of devaluation.
-
By definitively rejecting the possibility of inflationary finance through dollarization, countries strengthen their financial institutions and create positive sentiment toward investment, both domestic and international.
Governors noted the following recommendations from the study:
i) There is need for countries to avoid policies that may lead to stagflation and severe macroeconomic disruptions which precipitates the need for dollarization.
ii) Successful de-dollarization requires implementation of an appropriate mix of sound macroeconomic policies, market-based incentives, and microprudential measures including:
-
Active bank supervision to ensure that banks fully cover their foreign currency loans positions
-
Having a higher reserve requirement on foreign currency liabilities helps make such liabilities more costly
-
Maintaining a sufficient level of international reserves
-
Regulations to encourage use of local currency (e.g. prices to be denominated in local currency)
-
Policies that promote use of the local currency for payments through convenient and lower-cost services than for foreign currency
-
Moving toward risk-based supervision could help better monitor risks taken by banks in extending credit.
Enhancing the effectiveness of fiscal policy for domestic resource mobilization in the COMESA region
Introduction
One of the key lessons from the Euro debt crisis of 2011 has been the importance of long-term fiscal sustainability in economic development. The crisis in Greece and Spain was largely attributed to fiscal indiscipline over a long period of time. Recent trends in fiscal performance of most countries in the COMESA region demonstrate shrinking fiscal space as revenue mobilization has been slow compared with the fast increasing spending growth. For most COMESA member countries there is a wide gap between total investment needs and domestic resource mobilization. In order to achieve sustained growth, COMESA member countries are therefore, expected to pursue prudent fiscal policies supported by increased domestic resource mobilisation in order to ensure faster pace of monetary integration which will culminate in monetary union.
The justification for prescribing prudent fiscal policy to enhance regional integration is that they ensure the viability and sustainability of the monetary integration programme, by ensuring that a member state does not out pace other members in terms of larger budget deficit and inflation rates. Prudent fiscal policies also protect member countries from being exposed to contagion effects of macroeconomic instability in one or more member countries. It also contributes for effective domestic resource mobilization for increased investment.
In order to achieve fiscal prudence in member countries, the COMESA Summit adopted in 2012 the COMESA Multilateral Fiscal Surveillance Framework. The Surveillance process is based on countries developing national convergence programmes that will be the subject of the Multilateral Fiscal Surveillance Mechanism.
The purpose of this paper is to consider the relationship between fiscal policy and domestic resource mobilization in the COMESA region. The overall goal of the paper is to present alternatives for increasing the mobilization of resources to accelerate growth and facilitate poverty reduction.
The role of fiscal policy in economic development
The role of fiscal policy in developed economies is to maintain full employment and stabilize growth. In contrast, in developing countries, fiscal policy is used to create an environment for rapid economic growth. The various roles fiscal policy plays in this regard are the following:
-
Mobilisation of domestic resources: Developing economies are characterized by low levels of income and investment, which are linked in a vicious circle. This can be successfully broken by mobilizing domestic resources for investment energetically. Fiscal policy can play an important role in enhancing domestic resource mobilisation
-
Resource allocation to achieve accelerated growth: Fiscal policy entails use of government expenditure and tax policies to boost efficiency and improve long term economic performance by dealing with critical market failures. For instance, government provisions of infrastructure, research and development, or education among other public goods which the private sector itself is unable to provide in optimal quantity or quality because of market failures, are good examples. However, benefits of a change in public expenditure need to be weighed against how the expenditure is financed. Most taxes generate distortions and efficiency costs while public borrowing and growing debt affect growth. The government has not only to mobilize more resources for investment, but also to direct the resources to those channels where the yield is higher and the goods produced are socially acceptable.
-
Reduce inequality by investing in human capital: This will be done by increased spending on education and health. Spending that improves the quality of health and education services at all levels will endow the population with the necessary tools to take advantage of opportunities and thus reduce inequality. It is therefore, imperative that budgets provide adequate resources to build the human resources for the future, including improving school infrastructure, educational materials and equipment, clinics, and hospitals. Inequality can also be reduced by explicit policies to enhance social protection, food security and nutrition; as well as development of low income housing.
-
Increasing employment opportunities: Fiscal incentives, in the form of tax-rebates and concessions, can be used to promote the growth of those industries that have high employment generation potential. Moreover public investment (including PPPs) on infrastructure such as transport, logistics, energy, water resource development, schools, hospitals will help create employment directly in the formulation and construction of projects, the production of inputs for the projects, and the operation and maintenance of new facilities. Public investment also crowds in private investment and so would create employment indirectly by improving the efficiency of the economy and laying the basis for faster growth.
-
Macroeconomic stabilization: This entails using countercyclical fiscal policy in the short run to offset the impact of macroeconomic shocks that create large or persistent gaps between aggregate demand and potential output, thereby helping to avert both excessive cyclical unemployment and inflationary pressure. In the long run, macroeconomic stabilization entails keeping fiscal deficits and public debt on a sustainable path, so that public finances do not themselves become source of macroeconomic instability.
The ability to perform the above mentioned role of fiscal policy depends particularly on domestic capacity to mobilise resource especially public revenue. Effective mobilization of domestic resources can generate the following benefits among others:
-
Taxation, which is the major component of domestic resources for most countries in the region, is generally associated with more efficient resource use, accountability and greater public participation required for the success of development process.
-
Relying on domestic resources negates the effects of Dutch disease commonly associated with external inflows, and reduces the vulnerability to speculative attacks on currencies or even financial crisis.
-
Domestic resources brings about a sense of patriotism and ownership of development policies and outcomes unlike foreign aid that comes with conditionalities, constraining a country’s ability to maneuver and adopt policies that are consistent with its national development goals. That is, domestic resources give governments’ the latitude required to use fiscal policy to achieve their development objectives.
-
Domestic resources are predictable, less volatile and stable than external finance. Reliance particularly on foreign aid is facing serious head winds including donor fatigue, many unmet conditionalities, mismatch between pledges and actual disbursements, and changing motives by donors which make access to aid more difficulty. Falling foreign aid resources and volatility of commodity prices have only made the situation worse, calling for renewed efforts to accelerate mobilization of domestic resources as well as for reforms to increase spending efficiency.
However, the benefits of domestic resource mobilisation only accrue to countries that make deliberate efforts to exploit the existing opportunities especially since resource mobilization is not a costless activity and its effectiveness depends on whether governments have the political will and capacity to create a conducive environment as well as put in place the appropriate policy measures. The important role of fiscal policy in domestic resource mobilization emanates from its effect on the capacity of government to increase domestic revenue through various taxes and expenditure policy measures and how such measures in turn affects households and firms incentive to save and work. Mobilizing domestic resources is therefore, an expensive affair and requires concerted efforts from individuals, firms and governments.
Challenges to Fiscal Policy Implementation
The following are some of the challenges for fiscal policy implementation in COMESA member countries:
-
Low level of private savings. This is partly because of a large informal sector, where transactions do not pass through the formal banking system; low incomes due to the high level of poverty; and inadequate incentives for people earning low incomes to use formal banking services.
-
A sizeable portion of most economies in COMESA is non-monetized, rendering fiscal measures of the government ineffective and self-defeating.
-
Lack of statistical information as regards the income, expenditure, savings, investment, employment etc. This makes it difficult for the public authorities to formulate a rational and effective fiscal policy.
-
Fiscal policy cannot succeed unless people understand its implications and cooperate with the government in its implication. This is due to the fact that, in developing countries, a majority of the people are illiterate.
-
Large-scale tax evasion, by people who are not conscious of their roles in development, has an impact on fiscal policy.
-
Fiscal policy requires efficient administrative machinery to be successful. Most developing economies have corrupt and inefficient administrations that fail to implement the requisite measures vis-à-vis the implementation of fiscal policy.
-
Private capital flows especially in form of foreign direct investments have not had a noticeable impact in filling the resource gap since many countries in the region have not been very attractive to such flows although the trend is now changing. Political instability, security, infrastructure deficit and low incomes are some of the main hindrance to foreign direct investments.
Summary and Conclusions
In COMESA region as elsewhere, fiscal policy can and should be used effectively to foster growth, reduce short term fluctuations of economic activity and maintaining economies close to their potential growth paths. The necessity to carry out these tasks is emphasized by the following conclusions:
-
Domestic revenue to GDP ratios remain low for most member countries (figure 2) attributed to among others low per capita income and growth, institutional problems and weak governance. Addressing these challenges provides a case for fiscal policy in domestic resource mobilization.
-
Improved fiscal policies are needed to increase revenue mobilization. These policies include, reducing tax exemptions and incentives, increasing VAT rates on luxury consumption goods, increasing the outreach of property taxes and excise duties, reducing dependence on trade taxes through diversification of the tax structure, among other policies.
-
Addressing inefficiencies and improving tax and custom administration through computerization of tasks, improved tax audits and reporting, and training of tax officials among others, increases tax revenue without the need to raise rates of existing taxes.
-
Good governance is required in order to deal with corruption, tax evasion and avoidance and to link tax collection to service delivery. Improving efficiency, better public finance management, accountability and transparency in the use of public funds are important in enhancing domestic resource mobilization.
-
The need to contain external debt to sustainable levels is necessary for enhancing domestic resource mobilization. High external debt results in future capital outflows and often creates debt–servicing difficulties in the short-run. High debt increases vulnerability to shocks thereby contributing to macroeconomic instability which constrains growth. Alternatively, domestic borrowing is equally problematic since it exacts pressure on domestic real interest to rise, reducing private sector credit, private investment and growth, which in turn adversely affects domestic resource mobilization.
-
The public sector can contribute to domestic resource mobilization by indirectly boosting private savings through a number of ways including creating a good physical and social environment as well as adopting appropriate economic policies. Policies to address the high cost of doing business, raise incomes, address weak domestic financial infrastructure and systems, promote capital market development and financial inclusion, reduce dependency ratio, ensure macroeconomic stability, reduce capital flight, ensure good governance and political stability will significantly boost private savings which in turn will enhance domestic resource mobilization.
-
Public investment is essential for fostering growth in the region, which implies a pragmatic approach to fiscal deficits. If a country’s long-term average growth rate is low, as is the case for most member countries, it is appropriate to increase public investment in order for the country to reach its long term potential. Similarly, governments can use current expenditure as the counter-cyclical mechanism to generate the additional demand necessary to reach the greater potential created by the public investment. Using current expenditure to compensate when private demand is insufficient to keep growth near its potential implies increasing fiscal deficits or reducing surpluses.
-
The use of fiscal deficits for counter-cyclical management and to fund public investment need not be inflationary. Inflation in most member countries has a strong structural component which can be addressed through growth and development of economic and financial infrastructure rather than through deficit reduction.
-
Increasing public revenue requires rational approach to foreign investment based on explicit assessment of costs and benefits. It is rational policy to maximize the benefits of foreign investment, including the revenue benefits.
-
In COMESA region, private saving is constrained by poverty of households and the underdevelopment of the so called formal sector. Raising savings rate will be a long term task, achieved through the development of medium and large scale private enterprises and rising income of the workers. Governments should also pursue aggressive policies of financial system development.
-
Research indicated that for more than forty years, 1965-2006, 40% of development assistance went to domestic consumption, more than one third to capital outflows and only one quarter to domestic investment. This distribution, contrary to all principles of fostering growth and development, could be changed with donor flexibility.
-
Remittances from both workers who are temporarily abroad and long-term diaspora households represent a potential albeit small source of domestic investment. Governments design schemes to bring some remittances into formal financial channels, while accepting that the high consumption rate of remittances limits the potential to do so.
-
Reversal of capital outflows, “capital flight” could have a dramatic impact on resource mobilization. Independent research suggests these outflows were enormous. Capturing even a small part of capital outflows could dramatically increase public revenue.
Related News


Interdependencies between countries and policy areas: UNCTAD’s role in the 2030 Agenda
A new Policy Brief examines how the UNCTAD concept of interdependence may be employed in the follow-up and monitoring process of the 2030 Agenda for Sustainable Development.
The 2030 Agenda for Sustainable Development substantially increases the demand for evidence-based analysis and integrated and coordinated policy support in the area of expertise of UNCTAD. Its comprehensive and integrated nature mirrors the UNCTAD concept of interdependence between countries and policy areas.
This concept can now be employed in the follow-up and monitoring process of the Agenda to assess: (a) the impact of the international environment on the effectiveness of national implementation strategies; and (b) trade-offs and synergies in those strategies.
Tailored policy support to member States should alleviate national implementation and reporting burdens, thereby facilitating the adoption of coherent national implementation strategies.
Closer collaboration among the multiple stakeholders in the new development agenda will facilitate the effective use of the skills and expertise available across the United Nations system.
Key points:
-
The 2030 Agenda for Sustainable Development requires evidence-based analysis and integrated and coordinated policy support in the area of expertise of UNCTAD.
-
Tailored support to member States should alleviate implementation and reporting burdens, facilitating the adoption of coherent national implementation strategies.
-
Multi-stakeholder collaboration will facilitate the effective use of skills and expertise available across the United Nations system.
An enabling international environment can make or break implementation at the national level
While primary responsibility for the implementation of the 2030 Agenda for Sustainable Development lies at the national level, the comprehensiveness and universality of the Goals makes a supportive international environment an important determinant of effective implementation. Such an environment takes the form of supportive global trends, international policy frameworks, multilateral rules and effective partnerships, and may be reflected in seven channels:
-
The trade channel. While trade integration generally improves efficiency of production, the contributions of trade to investment and ensuing enhanced production, technology upgrading and productivity growth are more important for sustainable development. Exporting increases market size and generates economies of scale that make firms more productive and invest to further expand productive capacity. Export earnings also allow financing imports of capital equipment that embody advanced technology, as well as goods required to address basic needs, such as medicine. These links between trade and investment catalyse structural transformation, employment creation and skills development, directly supporting the accomplishment of Goals 8, 9 and 10.
-
The investment channel. Implementing the Goals in developing counties requires an investment push of an estimated $3.3 trillion to $4.5 trillion a year, with current levels of investment leaving an annual gap of $2.5 trillion. Foreign-direct investment (FDI) flows can boost investment in developing countries beyond domestic investment, while a dominance of mergers and acquisitions over greenfield investment would make FDI contribute little to building productive capacity.
-
The finance channel. Financial integration confers benefits when it helps to finance imports of capital goods for the creation of productive capacity and reduce pressure for macroeconomic adjustment to temporary shocks. It can also make domestic financial markets more efficient. However, financial integration increases vulnerability, as cross-border private capital flows tend to be highly volatile and associated with global financial cycles with often adverse consequences for macroeconomic stability, the sustainability of foreign-currency denominated debt and income distribution. The balance of these effects is country specific. Benefits are more likely to occur in countries with strong financial regulation and a high level of financial development. The finance channel would be strengthened by bringing the level of official development assistance to internationally committed levels and reorienting such assistance in line with the strategies of recipient countries to implement the Goals.
-
The technology channel. Expanding the digital revolution into production processes promises universal benefits by reversing the slowdown in productivity growth that has plagued the world economy over the past few years. Its development benefits will add to those derived from enhanced technology transfer, especially when innovation-based investment raises productivity growth and allows workers operating new machinery and software to demand higher wages, with resulting higher aggregate spending further boosting investment and the prosperity of society as a whole. Innovation could also enhance the environmental sustainability of creating productive capacity. If the recent substantial decline in the cost of producing solar and wind energy continues, there will be massive investment in renewable energy that would substantially transform the global energy sector. It could also transform the world economy itself, for example by triggering major productivity increases and accelerating growth in the real economy, irrespective of how the digital revolution is going to move forward.
-
The regulatory channel. Norms governing international trade have increasingly been set through bilateral and regional agreements. These often spur global trade less than multilateral agreements, as they are less about market access and more about regulatory convergence and standards that reshape global value chains. Further, their norm setting is non-inclusive and distorts international competitiveness by providing different trading partners with different conditions, often at the expense of lower-income countries that see their preferential margins in international markets erode. International investment agreements govern FDI but are often perceived as paying insufficient attention to inclusive growth and the Sustainable Development Goals. Trade and investment agreements may also unduly hamper domestic policies and regulation set in the public interest. Financial reforms agreed at the international level may insufficiently take account of developmental needs by prescribing overly complex implementation requirements and encouraging too little the proliferation of financial products and organizations that support investment in productive capacity.
-
The fiscal channel. Fiscal revenues are a prime source of finance for public investment. But their international origin has been limited by so-called “tax optimization” strategies of transnational corporations that declare profits in tax havens. According to UNCTAD estimates, investment-related tax avoidance schemes cost developing countries some $100 billion annually – about twice the amount of FDI that went to Africa in 2015. Decisive multilateral action in this area would help augment public revenue available for the investment push needed to attain the Sustainable Development Goals.
-
The institutional channel. Unresolved institutional deficiencies regarding sovereign debt workouts and the provision of official international liquidity in periods of balance-of-payments difficulties raise questions about the development orientation, coherence and consistency of the international monetary and financial architecture. These deficiencies, combined with the close interlinkages between the trade and finance channels through the balance of payments, tend to reduce support from the global economic architecture to sustainable development.
Addressing these channels in an integrated way from the perspective of sustainable development will make it possible to develop a forward-looking assessment of the support from the international environment to the effectiveness of national implementation strategies and of the collective implications of national measures for global processes.
Related News

Going beyond goods: Measuring services for export competitiveness
The simplest way to think about international trade is the transfer of goods – cars, clothing, bananas. Countries that export more goods are generally better off, because they’re earning money, which allows them to import and build their economies in the process. But services are also vital to exports. In fact, services play a dual role in building an economy’s export competitiveness.
For one, services matter for manufacturing and agriculture exports. Take tee-shirts for example. Sure, they’re made of cotton, but they’re also the result of many service industries. This can include transporting cloth to the factory, tee-shirt design, testing to ensure quality standards are met, and branding and marketing for sale on international markets. All are part of the tee-shirt exporting process.[1]
The second role services play in export competitiveness involves diversification. With cost reductions and technological progress, services have become more tradeable. Exporting services provides an opportunity for export diversification and growth, which is important for economic stability. If global demand for one sector drops, a country with diversified exports can rely on others such as banking, transport, or business services.
Many governments are interested in how services support their country’s exports and economy at large. For example, how much value added do services exports, such as transport or communications, generate in a country? And how much of that is generated directly versus indirectly as inputs like transportation in our tee-shirt example? What types of services inputs, and is that different from comparator countries?
Answers to such questions are typically left unanswered because systematic data is not readily available on how services contribute to exports across developing countries and sectors.
The Export of Value Added (EVA) Database was developed to fulfill this need. The database was recently launched on the World Bank Group’s World Integrated Trade Solutions (WITS) data website. It includes data for user-specific queries and also has data for bulk download.
The EVA Database measures the domestic value added contained in exports for about 120 economies across 27 sectors, including nine commercial services sectors, three primary sectors, and 14 manufacturing sectors. The data spans intermittent years between 1997 and 2011.
What sets the EVA Database apart is the wide coverage of developing countries: over 70 of the economies included are low- and middle-income.
Measuring trade on a value-added basis makes it possible to see a sector’s direct value-added contribution to exports as well as the linkages to other sectors of the economy. So, in the case of our tee-shirt example, it could tell you how much value added the transport sector contributes to $100 of exported goods. This includes both forward linkages (the contribution of a particular sector as an input to others sectors’ exports) and backward linkages (the contribution of all other sectors to a particular sector’s exports).
Services trade data is usually measured in gross values: direct value added plus domestic and foreign intermediate inputs. Measuring gross exports may undervalue a sector’s real contribution to trade if its value added is embedded as inputs in other sectors’ exports, something that is particularly true for services exports. On the other hand, gross measures may overvalue a sector’s importance if exports are embedded in other sectors’ value-added inputs, something that is particularly true for manufacturing exports.
This alternative way of measuring trade overcomes this shortcoming, as illustrated clearly in the EVA data presented below. We plot the percent of services in total exports, measured as gross values in the left panel, and total value added (direct plus forward linkages) in the right panel. With EVA data, the share of services in total exports increases for all highlighted Latin American countries, indicating that gross exports tend to undervalue the importance of services for a countries’ export basket.
Thus, we are able to provide a better picture of services exports by considering both the direct contribution and indirect contribution via forward linkages.
Figure 1: Share of services in exports, 2011

The EVA data also allows us to split services exports into its direct and indirect contributions. In Nepal and Singapore, services generate almost 60% of total export value added. More than half of this is done directly within the services sector. In Bangladesh, on the other hand, services are more important for other sectors like manufacturing.
Figure 2: How domestic services support exports, 2011

We can also look at the composition of services for other sectors’ exports. In Lao PDR, the structure of services inputs in manufacturing is fairly similar across the most important export sectors. However, the large majority of these services inputs are trade and transport. Finance, ICT and other business services are relatively less important.
Figure 3: Which domestic services support exports in Lao PDR, 2011

This information sheds light on how the interconnections between services with other sectors matter for exports. All this is essential to our understanding of export competitiveness, and ultimately economic growth, in developing countries.
Claire H. Hollweg is a Trade Economist with the Trade & Competitiveness Global Practice of the World Bank Group.
[1] To see this process in action, check out NPR Planet Money’s tee-shirt project, which follows the manufacturing and production of a simple shirt from start to finish around the world.
Related News


New data on East African private equity activity
The first ever dashboard on East African private equity deals has been released, another step forward in the quest for solid investment data on the African continent.
Put together by global professional investment services firm RisCura on behalf of the East African Venture Capital Association (EAVCA) the dashboard shows that Kenya is dominating the region as a hub of private equity activity.
The RisCura-EAVCA East Africa Private Equity Deal Dashboard surveyed 16 funds, of which 13 are EAVCA members, and 63 transactions, which Rory Ord, Executive at RisCura says provides a fair sample. Of those, the value of deals in 2015 was US$ 152 million, up substantially from the 2014 value of US$ 52 million.
Growth continues to be a theme, with just over two thirds of the 2015 deal value classified as growth capital. “This shows that the activity is not just about financial engineering,” says Ord.
Most of the funds that contributed to the sample invest more broadly on the continent than East Africa, and most of the capital comes from pan-African funds.
Sector concentration
The dashboard shows that deal activity in Africa is highly concentrated in a few key sectors. 35% of the deals by value are in the financial sector, including banks, insurance and asset management companies. A further third are in consumer-related companies, including both staples and discretionary consumer spending. This is followed by energy investments at 15%.
“These three sectors make up 81% of investment capital,” he says.
From a deal number perspective the story is slightly different. Consumer businesses still dominate the deal numbers with 40% of the volume. While financials is still the second biggest category by number of deals it makes up 14% of deals, compared to the 35% by volume. No other sector makes up more than 10% of deal volume.
East Africa continues to attract interest from private equity firms and investors. However, due to the early stage of the industry there is a need to continually track deals to establish individual firm track records.
“The private equity industry will continue to grow if performance is monitored and communicated to potential investors. The fundraising done to date by the region’s private equity pioneers is commendable and should encourage new GPs,” Ord concludes.
Related News


tralac’s Daily News Selection
The selection: Tuesday, 29 March 2016
Starting today, in Addis: Expert group meeting on the revitalization of the African Peer Review Mechanism (AU)
Today, in Nairobi: Uganda, Kenya, Tanzania talks on oil pipeline route options (The EastAfrican), [Oil pipeline deal: Tanzanian business lobby enters the fray (IPPMedia)]
Committee on Technical Barriers to Trade: documentation (WTO)
WTO members raised the 500th specific trade concern at a meeting of the Committee on Technical Barriers to Trade on 8-10 March 2016, marking a milestone in their discussions about product regulations and standards. Director-General Roberto Azevêdo qualified this work as “essential to avoid concerns escalating into disputes and to keep trade flowing.” Members also discussed how they use regulatory impact assessments to assess the impact that regulations have on trade. Some main points were the importance of public consultations, methodologies for identifying and assessing the trade impacts of regulation in RIAs, and which regulations should be subject to RIA.
Annual Review of the TBT Committee: The Committee completed its 21st annual review, which reports on its 2015 activities. During the previous year, notifications decreased by 12% compared to 2014 (to a total of 1,989 notifications). Nevertheless, the trend since 2005 has been an upward one driven increasingly by developing members. In 2015, developing Members continued to submit significantly more new notifications than developed members – also the number of notifications from LDCs increased during the year. A total of 37 technical assistance (TA) activities on TBT were organized by the WTO in 2015, and TBT-related TA activities are in high demand by WTO members. [Various downloads available]
ECA to launch a report on bilateral investment agreements (UNECA)
In 2015, ECA undertook a study 'Investment Policies and Bilateral Investment Treaties in Africa: implications for regional integration', to cast light on the prevalence, scope, application and contribution to investment as well challenges arising from these agreements. Bilateral investment treaties contain provisions for the settlement of investment disputes and between 1972 and 2014, Africa participated in 111 cases representing about one fifth of all those documented, which are treaty-based. About 107 of these cases were settled at the International Centre for Settlement of Investment Disputes, making it very difficult for African countries to defend their cases. The report therefore recommends to consider using regional courts such as SADC Tribunal. [Why developing countries are dumping investment treaties (The Conversation)]
Pan-African Investment Code: draft (2016 Conference of Ministers, UNECA)
The objective of this Code is to promote, facilitate and protect investments that foster the sustainable development of each Member State, and in particular the Member State where the investment is located. This Code shall apply to Member States as well as investors and their investments in the territory of Member States as defined by this Code. This Code defines the rights and obligations of Member States as well as investors, and principles prescribed therein.
2016 Conference of Ministers - profiled documentation: Status of African integration: the implications of Agenda 2063 and Agenda 2030 on African integration, Report of the ninth session of the Committee on Regional Cooperation and Integration, Proposed strategic framework for the period 2018-2019, ECA: biennial report 2014-2015, Tentative timetable: conference sessions, other meetings and side events
AGOA-IV and the trade prospects of sub-Saharan Africa (The Commonwealth)
An AGOA export strategy for SSA governments and exporters would be well advised to advance on two fronts: to take better advantage of existing and newly created opportunities under AGOA (including attracting export-oriented foreign direct investment to take advantage of these preferences); and to lobby for additional amendments that would open US markets further. Accelerating African regional economic integration (especially the envisaged Continental FTA) would facilitate prospects for developing supply chains within AGOA-eligible SSA for exports. [The author: Geoffrey Allen Pigman]
US chicken imports put BEE operation under pressure (Business Day)
Kholofelo Maponya, the CEO of Daybreak Farms, told Business Day that since the US imports started hitting South African shelves this month, when the first consignment of poultry was delivered to cold storage facilities, production losses became a reality. "We have reduced production by 15% and that is 1,000 or more jobs already at risk. We are already negatively affected by the increase that has flooded the market," Mr Maponya said.
Trade integration and global value chains in Sub-Saharan Africa: in pursuit of the missing link (IMF)
In Section 1, we document SSA’s international and regional integration over the past 20 years. In Section 2, we introduce the concept of centrality in the global and regional trade network, which takes into account, for each country, both the size of its trade and the number of its trade partners and their weight on global trade. The third section links trade openness with macroeconomic performances.
First conference on global value chains, trade and development: Q&A (World Bank)
Daria Taglioni, Lead Trade Economist and Global Value Chains Global Solution Lead for the World Bank Group, and Paola Conconi, Professor of Economics at the Université libre de Bruxelles, share their insights as the organizers of the conference, 30-31 March.
Africa and its visa pains: where even billionaire Dangote-type big fish have nightmares (M&G Africa)
Aliko Dangote could be forgiven for hoping that his status as one of the continent’s more recognisable faces could buy him some extra minutes to locate a missing passport, but an anecdote he narrated recently in Ivory Coast suggests that being the Africa’s richest man does not automatically buy you good immigration custom care. Speaking recently at the Africa CEO forum in the financial capital Abidjan, the Nigerian said he on a visit to South Africa forgot one of his many passports—he says he has eight—and which contained his visa back in his jet.
But by the time he realised it, immigration authorities in his would-be African host were well on their way to bundling him out, having grown high-pitched and agitated at his frantic efforts to locate the travel document. Meanwhile, in the background, his American staff were breezing by, having been waved through almost nonchalantly by the same officials. [The author: Lee Mwiti]
Sanral to collect road charges at Beitbridge post (Business Day)
The South African National Roads Agency Limited is due to start levying road charges on south-bound traffic at Beitbridge, the country’s busiest land border post. However, motorists should not expect a change in fees, according to the roads agency. Sanral spokesman Vusi Mona explained that a bilateral agreement entered into by the two countries in 1994 stated that each state would be responsible for collecting the respective road charges. "Sanral is now carrying out its contractual obligation”. [Little traffic at Ressano Garcia over Easter (Club of Mozambique)]
SADC states plan highway to bypass Zim (Zimbabwe Independent)
Zimbabwe could lose millions of United States dollars in annual revenue earnings for its continued failure to maintain and upgrade its road infrastructure, amid revelations that South Africa and other Sadc countries are planning a new road network to bypass the country largely because of the bad state of the Beitbridge-Harare-Chirundu Road. Transport minister Jorum Gumbo confirmed the plan, but said government was moving fast to expedite the long-awaited rehabilitation of the Beitbridge-Harare-Chirundu Road, saying further delays could be costly to the country. [Zim-SA trade ties: tightening loose ends (The Chronicle)]
Kenyan firms benefit from increased use of financial services, lower crime-related losses (World Bank Blogs)
This blog focuses on surveys conducted of 781 Kenyan firms across five regions (including Nairobi and Mombasa) and six business sectors - food, textiles and garments, chemicals, plastics and rubber, other manufacturing, retail, and other services. [The author: Silvia Muzi, Asif Islam]
From Thika to Webuye, the recurrent story of collapsed industries (Sunday Nation)
Once upon a time, Thika was Kenya’s industrial hub with a mix of agricultural, auto and fire-belching metal work factories. Today, some of its deserted factories — victims of rash policies and competition — are a daily reminder of the town’s industrial descent with sections of the abandoned rust-wrecked railway line cutting across private property or vanishing into overgrown thickets. The halcyon days when these rail lines brought people and goods into Thika and sent products into distant markets are long gone. The same story is being repeated some 482 kilometres northwest of Magadi at the small town of Webuye where the cost of energy brought down Kenya’s sole paper milling factory. The collapse of Pan African Paper Mills has turned the once-booming town into a near ghost town which remains a case-study on the impact of obsolete technology and high fuel costs. [The author: John Kamau]
Kenya: Manufacturing still major driver of growth (Daily Nation)
It is easy to conclude that the era of industrialisation has given way to other sectors, such as the service industry. The assumption is based on the fact that the economies of many developed countries shifted to the service sector in the late 1980s. In the past three years, however, this thinking has changed. Developed countries have seen a growth in their manufacturing sector, with jobs increasing by 2.6% and uplifting their economies. The contribution of industrialisation to the growth of the economy of many countries, including Kenya, cannot therefore be discounted. The government and industry should collaborate to develop a robust policy to strengthen our manufacturing sector. A national manufacturing policy requires us to evaluate the strengths, weaknesses, and opportunities of the other sectors of the economy. This policy should aim at increasing the current level of the manufacturing in the GDP from 11 to 15%. [The author, Julius Korir, is Principal Secretary in the Industrialisation Ministry]
Related: Manufacturing solar panels in East Africa: rising demand, but challenges remain, Kenya Vision 2030: mega projects well under way but growth remains elusive (The EastAfrican)
Made in Nigeria and the complications (ThisDay)
We can actually “crush imports” as Emefiele wishes, but the CBN is just one of the agencies needed to make it happen. We need to implement, not just conceive, pro-Made in Nigeria policies that will fertilise the growth of industry. We must make policies on trade, tariffs and taxes to our own advantage. We need infrastructure and cheap capital. We need border security to curb smuggling so that we don’t gain on the right and lose on the left. Above all, Nigerian companies must dream like Sony to change the poor-quality image of “Made in Nigeria”. It is one thing to market a product with sentiments — it is another thing for the consumer to be satisfied and keep asking for more.
Related: South Africa-Nigeria forging ahead with solid minerals (ThisDay), Stakeholders seek return of export expansion grant (ThisDay), Nigeria’s problems are compounded by sub-national debt (Financial Times), Jibrin Ibrahim: 'President Buhari - one year after the mandate' (Premium Times)
CIF Annual Report 2015 (AfDB)
The AfDB has released 'Financing change: the AfDB and CIF for a Climate-Smart Africa', its 2015 annual report for its climate investment funds portfolio. The report demonstrates that by the end of 2015 through its AfDB-supported CIF portfolio, 27 African nations – half of Africa – had become engaged in various aspects of climate solutions, and through 39 pilot programs are embedding them in their national development economic and social goals.
Global trends in renewable energy investment 2016 (UNEP)
All investments in renewables, including early-stage technology and research and development as well as spending on new capacity, totalled $286bn in 2015, some 3% higher than the previous record in 2011. Since 2004, the world has invested $2.3trn in renewable energy (unadjusted for inflation).
EAC Partnership Fund high-level dialogue: update (EAC)
EABC: consultancy opportunity for designing a Brand Book
MENA: enhanced coordination of food safety in the region (UNIDO)
Mariya Badeva-Bright: 'Taking African law online — and why it matters' (Daily Maverick)
Engaging civil society in Pan-African issue: call for proposals (EU)
Egypt: PM unveils ambitious programme to revive economy (Ahram)
The labour content of exports database (World Bank)
African merchants in China and the African-China mobile phone trade (Columbia)
SDG indicators challenged by many UN member states (Third World Network)
tralac’s Daily News archive
Catch up on tralac’s daily news selections by following this link ».
SUBSCRIBE
To receive the link to tralac’s Daily News Selection via email, click here to subscribe.
This post has been sourced on behalf of tralac and disseminated to enhance trade policy knowledge and debate. It is distributed to over 350 recipients across Africa and internationally, serving in the AU, RECS, national government trade departments and research and development agencies. Your feedback is most welcome. Any suggestions that our recipients might have of items for inclusion are most welcome.
Related News


Kenya Vision 2030: Mega projects well under way but growth remains elusive
Kenya’s ambition of becoming a middle-income economy with per capita income of between $1,045 and $12,736 hangs in the balance as the government struggles to meet key growth targets under its long-term development plan called Vision 2030.
Latest data from the Kenya Vision 2030 Delivery Secretariat paints a grave picture of the achievements made in the past eight years with concerns over low levels of economic growth, domestic savings, national investments and employment figures.
Kenya’s economy has grown at an average rate of four per cent in eight years against a planned 10 per cent, thanks to the poor performance of key economic sectors such as agriculture, manufacturing and tourism.
“We are still at the lower end with respect to national savings as compared with the other East African countries. This can partly be explained by the high cost of living in Kenya,” Prof Gituro Wainaina, the acting director general of Kenya’s Vision 2030 Delivery Secretariat, told The EastAfrican.
According to the latest World Bank classification criteria, middle-income countries are those with a gross national income (GNI) per capita of more than $1,045 but less than $12,736 while low-income economies are those with GNI per capita of $1,045 or less. High-income economies are those with a GNI per capita of $12,736 or more.
Kenya’s regional counterparts have also developed their own development blueprints – Uganda has formulated Vision 2040, Tanzania Vision 2025, Burundi Vision 2025 and Rwanda has Vision 2020 – but there are plans to align all of them to the EAC Vision 2050.
Official government data shows that Kenya is lagging behind in achieving its key objectives under the development plan.
During the first five years (2008-2012) of the plan, Kenya’s economy grew at an average rate of 4.18 per cent against a target of 8.66 per cent while investment averaged 20 per cent of gross domestic product (GDP) compared with a target of 27 per cent.

An annual average of 511,000 jobs against a target of 740,000 jobs were created during the period of which about 80 per cent were in the informal sector. This is against a target of 3.7 million new jobs for the five years.
Gross national savings during the 2008-2012 period fell to an average of 12 per cent per annum against a target of 22 per cent per annum. According to data from National Treasury, gross national savings stood at 12.7 per cent, 14.5 per cent and 15.9 per cent in 2013, 2014 and 2015 respectively.
“We have not met our investment targets because of our ambitious investment, especially in infrastructure. In addition to foreign direct investments, we need to focus on mobilising the domestic savings through pension funds, saccos, and the insurance industry,” said Prof Wainaina.
In the second medium-term plan (2013-2017), national investment is expected to grow from 24.7 per cent of GDP in 2013 to 30.9 per cent in 2017 while gross national savings are expected to grow from 16.4 per cent to 25.7 per cent over the same period. But data from the National Treasury shows that national investments as a percentage of GDP for the years 2013, 2014 and 2015 stood at 21.7 per cent, 23.5 per cent and 23.5 per cent respectively.
Gross international reserve coverage is expected to increase from 4.1 months of import cover to six months. Currently, foreign exchange reserves stand at $7.37 billion (equivalent to 4.7 months of import cover) according to data from the Central Bank of Kenya.
The debt to GDP ratio is projected to decline to 39.2 per cent by 2017/2018 from 43.9 per cent in 2013/14. Currently the debt ratio stands at 43.7 per cent.
In the second medium-term plan under the Vision 2030, the government projected growth to gather pace from about 6.1 per cent in 2013 to 8.7 per cent in 2015 and reach 10.1 per cent in 2017.
Challenges to growth
Treasury Cabinet Secretary Henry Rotich, however, said the economy grew by 5.3 per cent in 2014 and is projected to expand by 5.6 per cent in 2015, six per cent in 2016 and 6.5 per cent in the medium term.
According to the Kenya Vision 2030 Delivery Secretariat, challenges related to lack of funding, lengthy procurement processes and litigation on tender awards, land acquisition and compensation issues as well as high transaction costs have worked out to stifle implementation of flagship projects.
During the second MTP, the government is expected to create one million new jobs annually to address youth unemployment and improve skills training.
A total of 5,170 employment opportunities were to be created over the five-year period (2013-2017) translating into an average of 1,034 jobs – 1,513 formal and 3,657 informal – per year.
Kenya’s Vision 2030, which was officially launched in July 2008, aims to transform Kenya into a newly industrialising globally competitive and middle-income country providing a high quality of life to all its citizens by 2030.
The key flagship projects under the plan include paving of 10,000 kilometres of roads by 2017 and generation of over 5,000 MW of power in 40 months. The current generation stands at 2,298 MW – of which 65 per cent is from renewable sources.
Other flagship projects include the Lamu Port Southern Sudan-Ethiopia Transport Corridor project, the Konza Techno City, modernisation of Jomo Kenyatta International Airport (Greenfield terminal and second runway), expansion of the port of Mombasa, and the standard gauge railway (SGR).
Currently there are 164,000 kilometres of road network in the country of which 13,000 kilometres are paved.
An additional 10,000 kilometres had been earmarked to be paved by next year, of which, 80 per cent will be rural roads and 20 per cent urban roads.
Related News


AGOA-IV and the trade prospects of sub-Saharan Africa
The African Growth and Opportunity Act (AGOA), a piece of US domestic legislation first passed by Congress and signed into law in May 2000, was a product of US efforts to reorient US trade policy following the end of the Cold War. Around the same time, the USA had devised a ‘Big Emerging Markets’ strategy aimed at deepening US trade and investment relations with ten fast-growing nations with large and expanding middle classes, ranging from China, India and Brazil to Turkey and Poland (plus newly post-Communist Russia in addition to the ‘Big Ten’).
The strategy involved offering to open US markets to exports from big emerging markets in return for their governments’ commitments to market liberalisation, good governance and democratisation. The longer term US objective was to open these markets to US exports and investments. While South Africa, then newly under majority rule, was on the Big Ten list, the USA needed a broader approach to trade policy with Sub-Saharan Africa (SSA). AGOA became the means to extend this emerging markets trade and investment strategy to Africa.
AGOA has since become the centrepiece of US-SSA trade relations and was recently renewed until 30 September 2025. However, notwithstanding AGOA’s significance, bilateral trade between the USA and SSA countries remains limited and concentrated in certain sectors, while overall AGOA exports, most notably oil, have been declining in recent years. Against this backdrop, this issue of Commonwealth Trade Hot Topics provides a brief overview of AGOA’s evolution and AGOA-IV’s main provisions and highlights some of the opportunities and challenges for promoting SSA's trade in the future.
Trade trends under AGOA 2001-2015
Combined two-way trade between the USA and AGOA-eligible SSA countries has doubled between 2001 and 2014, with a consistent but steadily declining trade surplus for eligible AGOA countries (imports and exports were broadly balanced in 2014 and 2015). As Figure 1 shows, total trade grew steadily from US$28 billion in 2000 to the peak of US$100 billion in 2008, the year before the global financial crisis had its greatest impact on the US economy. By 2011, trade had mostly recovered but has been on a downward trend since then largely due to movements in oil prices and exports of oil products, as discussed later. In 2015, combined two-way goods trade was valued at US$36 billion, compared to $50 billion (2014), $61 billion (2013) and $66 billion (2012). US exports to SSA have grown steadily under AGOA, excepting for the impact of the 2008 financial crisis and the likely effect of the high US dollar exchange rate in 2015.

The overall impact of AGOA upon US imports has been minimal. In 2015 only US$19 billion, slightly under 1 per cent of total US goods imports of US$2.27 trillion, originated in SSA, a bit over half the value of which enter duty-free under AGOA or GSP. AGOA’s impact on SSA’s export performance (especially for non-oil producers) has been somewhat greater, although still only a small number of the countries eligible for AGOA benefits have sufficient domestic productive capacity to export enough to the USA to benefit significantly.
The US effective rate of tariff protection on imports from Africa was already low before AGOA. According to the International Monetary Fund, AGOA has only benefited SSA exports exposed to significant US tariff protection: 5 per cent of total exports, but 23 per cent of total non-oil exports. In 2000, prior to AGOA, only US$4 billion out of US$23 billion in SSA exports to the USA benefited under GSP. The main product additions to GSP duty-free entry under AGOA were petroleum products, apparel, and certain other industrial and agricultural goods. The average US tariff on petroleum imports was only 1.5 per cent. Its removal raised the price received by exporters by 1 per cent, thereby benefiting SSA oil exporters, such as Nigeria, Angola, Chad and Gabon. The average US apparel tariff was 13 per cent, but MFA quotas further restricted exports substantially until 2004. AGOA gives little additional tariff preference to LDCs: close to 90 per cent of products eligible for AGOA benefits were already tariff-free under enhanced GSP if imported from qualified LDCs. Additional potential SSA exports were still not included under AGOA, with 174 tariff lines bearing an average tariff of 2.5 per cent and a further 893 lines bearing an average tariff of 11 per cent.
The three categories of SSA exports under AGOA, namely oil, apparel, and other products, have followed very different, and largely unrelated, trajectories. While all AGOA exports declined following the 2008 global recession, apparel exports have been much more volatile for industry- and market-specific reasons, whereas oil exports first rose and then declined for secular reasons noted below. Other products, exported primarily from South Africa, have shown a secular increase in recent years.
Over the period 2001 to 2014, AGOA non-oil exports increased from US$2.8 billion to US$4.4 billion, representing an increase of US$1.6 billion. However, as Figure 2 highlights, the largest segment of SSA exports to the USA by far under AGOA has been oil, which consistently accounted for a share greater than 90 per cent of total exports under the scheme. However, 2014 is the notable exception, with non-oil AGOA exports as a share of total AGOA exports at its highest ever. This change in volumes of oil imports to the USA under AGOA has been the biggest driver of change in overall volumes of imports under AGOA. In the early years of AGOA, availability of oil imports from African producers such as Nigeria and Angola became particularly important strategically to the USA, as the USA sought to reduce dependence upon oil imports from the Middle East. However, in recent years oil imports to the USA have declined steadily, as domestic sources and alternative fuels have replaced imported oil in US energy markets. Oil import volumes to the USA under AGOA have been volatile. AGOA preferences do not affect the volume of SSA oil exports to the USA significantly, because the US import tariff on oil is so minimal, only 5-10 cents/barrel.

Of the two non-oil categories of AGOA exports, apparel has been considered most significant from a development perspective. Initially SSA apparel exports increased moderately under AGOA, benefiting from AGOA beneficiaries’ exemptions from broad US apparel quotas under the MFA. When the MFA ended in 2004, AGOA beneficiaries lost this advantage, cutting into SSA exports significantly.
AGOA benefits have stimulated and facilitated the development of apparel manufacturing industries significantly in a handful of SSA countries, including Ethiopia, Kenya, Lesotho, Madagascar, Mauritius and Swaziland, all of which are LDCs except for Kenya and Mauritius. The value of these AGOA benefits is enhanced in that they are not conferred upon most other beneficiaries of GSP. However, AGOA apparel exports have been criticised from a development perspective for promoting mainly low wage, low skill manufacturing, as there is relatively little evidence that apparel manufacturing is promoting development of higher-skill manufacturing jobs.
The third category of AGOA exports, that is, other (non-oil, non-apparel) products, has been dominated by South Africa. South Africa has been the largest non-oil exporter under AGOA. AGOA benefits to exports of South Africa are extensive and diverse in a range of export sectors. Motor vehicles have been the largest export in this category, which also includes steel, chemicals, and agricultural goods (primarily citrus and wine).
The US Government has taken seriously enforcement of AGOA eligibility criteria with regard to democracy, governance and open markets. Over the first 15 years of AGOA’s operation, eligibility has been granted, suspended, and in some cases subsequently restored, to several potential beneficiary countries. Two countries that have benefited most from exporting apparel under AGOA have been affected: Madagascar was suspended in 2009 and restored in 2014, while Swaziland was suspended in 2015. As of the end of 2015, 39 SSA countries out of 47 potentially eligible countries qualified for AGOA benefits. As of the time of writing, South Africa was under threat of suspension of AGOA benefits for agricultural exports, pending resolution of US complaints that South Africa was improperly imposing antidumping duties on US chicken imports to South Africa. The US dispute with South Africa, the largest potential market for US exports to SSA, reinforces the argument made earlier that the USA has viewed the AGOA relationship as an opportunity to grow trade in both directions. Figure 1 shows that US exports to SSA countries have grown steadily over the duration of AGOA, notwithstanding major shifts in US imports from the same countries. While this growth in US exports may be attributable more to Africa’s economic growth over the period than to AGOA, since the latter confers no tariff benefits, US trade diplomacy with AGOA beneficiaries demonstrates the US interest in using AGOA to grow exports to SSA further.
AGOA-IV: opportunities and challenges
Since AGOA’s initial enactment in 2000 for a sevenyear period, AGOA has been extended three times. Most recently, the Trade Preference Extension Act of 2015 (AGOA IV) was signed into law in September 2015, extending AGOA benefits for ten years to 2025. Exporting firms in SSA have regarded the relatively short, fixed terms of AGOA tariff preferences and GSP preferences alike as disadvantageous in terms of making investment decisions to construct facilities intended to produce exports aimed at the US market. AGOA’s now longer term than GSP makes it easier for businesses to make sourcing decisions favouring African suppliers.
AGOA-IV contains some changes that create new opportunities and also new challenges for SSA governments and exporters. Among the opportunities, as noted above, AGOA-IV extends eligibility for apparel manufactured in ‘lesser developed’ AGOA beneficiaries using third country yarn and fabric for the full ten years. The renewal also broadens the RoO for non-apparel manufacturing to include the value of processing as well as material in the 35 per cent minimum AGOA (or US) content required for AGOA eligibility. This provision increases the potential for AGOA exporters to invest in non-apparel processing facilities for light industrial, consumer and agricultural goods. AGOA-IV mandates the development of biennial AGOA utilisation strategies through a ‘bottom up’ bilateral process between AGOA beneficiary countries and US trade capacity-building agencies (such as USAID). The strategies should promote small business and entrepreneurship, facilitate regional integration, and include plans for AGOA beneficiaries to implement the 2013 WTO Agreement on Trade Facilitation. AGOA-eligible countries can also draw on broader US initiatives, like ‘Trade Africa’, a policy initiative that seeks to increase regional trade within Africa and expand trade and economic ties between Africa, the USA and other global markets.
AGOA-IV’s primary new challenge is a stepped up US process for monitoring AGOA eligibility. Any interested member of the public (in addition to the President and United States Trade Representative) may now comment on annual AGOA eligibility reviews. In addition to annual eligibility reviews, any interested party may now petition USTR for an outof-cycle eligibility review, which can lead to change in a beneficiary’s AGOA eligibility at any time upon 60 days’ notice. The outcomes of such reviews must be shared with relevant Congressional committees. The process makes it easier for US industries competing with AGOA imports and US exporters facing market barriers in AGOA beneficiaries to challenge beneficiaries’ AGOA eligibility. AGOA-IV takes a more nuanced approach to promoting eligibility, however, empowering the President to suspend AGOA benefits or limit them to only certain imports rather than terminating AGOA eligibility entirely. AGOA eligibility has also been further constrained slightly by the addition of protection of women’s rights to the governance criteria.
Looking ahead: strategies for SSA export growth
After 15 years of AGOA, it is clear that substantial opportunities for exports from SSA countries to the USA have been created. Yet for SSA, AGOA’s benefits are narrower than they could be: a relatively small number of eligible countries and economic sectors actually benefit from AGOA preferences. The principal limitations of AGOA’s ability to open US markets to SSA exporters are threefold. First, AGOA, like GSP, is limited to tariff preferences. Average tariffs in the industrialised world have fallen to 3.8 per cent under successive GATT and WTO multilateral trade agreements. The very success of GATT and WTO tariff cuts has made non-tariff barriers a progressively more significant and effective means for industrial country governments to restrict imports. Second, the list of products eligible for duty-free imports under AGOA, while more extensive than the GSP list, is still limited, with many major agricultural products, including cotton, excluded and no provisions facilitating services exports. By contrast, the Morocco-USA FTA addresses some non-tariff barriers (e.g. intellectual property protection) and liberalises trade in services (under GATS supply modes 1, 2 and 3). Third, AGOA RoO for apparel are now significantly less favourable for non-LDC SSA exporters than the EU's single transformation RoO being implemented in connection with the EU-SSA EPAs. On that basis alone, some SSA exporters may find the US a comparatively less attractive apparel export market than the EU.
The USA has used AGOA effectively to pursue a mixture of trade and non-trade policy objectives with respect to SSA countries, all the while limiting to a set of tariff preferences the range of policy objectives available to SSA countries. In addition to AGOA and policy initiatives such as Trade Africa, Washington has pursued SSA trade policy objectives through signing Bilateral Investment Treaties (BITs) with a limited number of SSA countries, which facilitate investment flows, as well as Trade and Investment Framework Agreements (TIFAs) with a number of SSA states and regional groupings, which create mechanisms for dialogue on trade and investment issues. Although AGOA-IV directs the US Trade Representative to begin the process of negotiating reciprocal trade agreements with SSA countries similar to the EU-EPAs, the short-term prospects for any new trade agreements with the USA, given the domestic US political climate, are not auspicious. Nonetheless, and especially considering that TIFAs are in effect purely aspirational, the incentive remains strong for SSA countries to consider negotiating development-friendly reciprocal trade agreements with the USA, provided they support and strengthen SSA's own integration processes.
Given the current US political environment, AGOA beneficiaries can advance their trade interests best by taking advantage of AGOA-IV’s provisions and by lobbying for additional amendments to AGOA. AGOA-IV does not preclude further modification by legislative amendment. The probable continued high US dollar value is likely to fuel US protectionism among import-competing industries but should also make AGOA exports better value in US markets, generating support from importers and consumers. Moreover, SSA countries’ prospects for better trade relations with the USA should be strengthened by the increasing alignment of economic and security interests between the USA and SSA. Both share an interest in diversifying SSA trade and investment relations, as China’s interests in SSA have continued to deepen. Both also have an increasing interest in extending security co-operation in the face of ongoing threats of international terrorism.
An AGOA export strategy for SSA governments and exporters would be well advised to advance on two fronts: to take better advantage of existing and newly created opportunities under AGOA (including attracting export-oriented foreign direct investment to take advantage of these preferences); and to lobby for additional amendments that would open US markets further. Accelerating African regional economic integration (especially the envisaged Continental FTA) would facilitate prospects for developing supply chains within AGOA-eligible SSA for exports. Targeting and co-ordinating development investment and assistance on building out trade-related infrastructure (transport, storage, cold chain, customs administration, etc.) would facilitate more regional manufacturing and agricultural processing supply chains in addition to improving access and lowering costs for less accessible and landlocked SSA countries. Governments and the private sector need to coordinate closely in working with US counterpart agencies in developing and implementing the mandated bilateral AGOA utilisation strategies to take full advantage of available resources. Particularly important, AGOA beneficiaries need to pool and invest resources in effective political monitoring and representation in Washington to ensure that they have advance warning of any potential threats to AGOA eligibility and the ability to deploy effective political strategies to counter any such threats in future.
SSA countries should lobby for AGOA amendments, which could be attached to future ‘miscellaneous’ trade bills. These could seek to make AGOA at least as favourable as the Morocco-USA FTA with respect to non-tariff barriers and trade in services, to adopt more flexible RoO, and to expand AGOA’s product coverage in ways that would benefit most the eligible countries that have been least able to take advantage of AGOA. Cotton is a prime example. The ‘Cotton Four’ low cost cotton exporting countries (Mali, Burkina Faso, Benin and Chad) are now on the frontline in the global war on terror. The security argument for including cotton under AGOA, if not for reducing US cotton production subsidies, is compelling in the present environment.
Looking ahead, US exports to SSA are likely to continue growing, furthered in some cases by the leverage that AGOA eligibility provides and supported by initiatives like Trade Africa and the TIFAs. SSA exports to the USA are likely to increase gradually, but not driven by oil as in the past. Over the medium to long term, as oil prices once again rise, the USA is likely to provide for most if not all of its oil needs from North American production. In due course US oil demand can be expected to decline as more renewable energy sources come on stream, especially following the successful Paris Climate Conference, where all countries made commitments to reduce greenhouse gas emissions and manage the impacts of climate change. (That said, given ongoing political instability in the Middle East, US demand for SSA oil exports, which originate from more stable and secure sources, could rise slightly again under particular circumstances.) Overall the diversification of AGOA exports by product and country of origin, which has already increased, is likely to continue to do so. Apparel exports should continue to grow, provided that existing RoO and AGOA eligibility for major apparel exporters are maintained. The major emerging challenge, however, is the conclusion of the Trans-Pacific Partnership (TPP), which could give apparel-producing competitors, such as Vietnam, a competitive advantage over SSA exporters, like Lesotho, in the US market.
South Africa-USA trade relations will remain more complex. Considerable export potential for South African goods and services exists, but bilateral trade relations are more likely to resemble US trade relations with Asian tiger economies such as South Korea and Taiwan than US relations with other AGOA beneficiaries. Although South Africa is not as large an economy as its BRICS counterparts, namely Brazil, Russia, India and China, US exporters nonetheless view South Africa as a large potential market for US goods and want to see that market as open as possible, especially since South Africa offers tariff preferences to European competitors under an FTA and is now also part of the Southern African Development Community (SADC) EPA with the EU. However, it should be noted that past attempts to negotiate an FTA with the Southern African Customs Union (SACU) failed because of US demands for a comprehensive trade agreement that included ambitious and extensive new generation trade issues. Given the potential trade effects of the TPP (for SSA) and the EPAs (for the USA), there may arguably be a case for greater negotiating pragmatism and flexibility to consider development-friendly reciprocal preferential trade agreements.
Geoffrey Allen Pigman is Research Associate in the Department of Political Sciences, University of Pretoria, South Africa. The views expressed in this article are those of the author and do not necessarily represent those of the Commonwealth Secretariat.
Commonwealth Trade Hot Topics is a peer-reviewed publication which provides concise and informative analyses on trade and related issues, prepared both by Commonwealth Secretariat and international experts.
Related News


Renewable energy investments: Major milestones reached, new world record set
Coal and gas-fired electricity generation last year drew less than half the record investment made in solar, wind and other renewables capacity – one of several important firsts for green energy announced on 24 March 2016 in a UN-backed report.
Global Trends in Renewable Energy Investment 2016, the 10th edition of the UN Environment Programme’s (UNEP’s) annual publication, launched on 24 March by the Frankfurt School-UNEP Collaborating Centre for Climate & Sustainable Energy Finance and Bloomberg New Energy Finance (BNEF), says the annual global investment in new renewables capacity, at $266 billion, was more than double the estimated $130 billion invested in coal and gas power stations in 2015.
All investments in renewables, including early-stage technology and research and development as well as spending on new capacity, totalled $286 billion in 2015, some 3 per cent higher than the previous record in 2011. Since 2004, the world has invested $2.3 trillion in renewable energy (unadjusted for inflation).

Just as significantly, developing world investments in renewables topped those of developed nations for the first time in 2015.
Helped by further falls in generating costs per megawatt-hour, particularly in solar photovoltaics, renewables excluding large hydro made up 54 per cent of added gigawatt capacity of all technologies last year. It marks the first time new installed renewables have topped the capacity added from all conventional technologies.
The 134 gigawatts (GW) of renewable power added worldwide in 2015 compares to 106GW in 2014 and 87GW in 2013.
Were it not for renewables excluding large hydro, annual global CO2 emissions would have been an estimated 1.5 gigatonnes higher in 2015.
UNEP Executive Director Achim Steiner said, “Renewables are becoming ever more central to our low-carbon lifestyles, and the record-setting investments in 2015 are further proof of this trend. Importantly, for the first time in 2015, renewables in investments were higher in developing countries than developed.”
“Access to clean, modern energy is of enormous value for all societies, but especially so in regions where reliable energy can offer profound improvements in quality of life, economic development and environmental sustainability. Continued and increased investment in renewables is not only good for people and planet, but will be a key element in achieving international targets on climate change and sustainable development.”
“By adopting the Sustainable Development Goals last year, the world pledged to end poverty, promote sustainable development, and to ensure healthier lives and access to affordable, sustainable, clean energy for all. Continued and increased investment in renewables will be a significant part of delivering on that promise.”
Said Michael Liebreich, Chairman of the Advisory Board at BNEF: “Global investment in renewables capacity hit a new record in 2015, far outpacing that in fossil fuel generating capacity despite falling oil, gas and coal prices. It has broadened out to a wider and wider array of developing countries, helped by sharply reduced costs and by the benefits of local power production over reliance on imported commodities.”
As in previous years, the report shows the 2015 renewable energy market was dominated by solar photovoltaics and wind, which together added 118GW in generating capacity, far above the previous record of 94GW set in 2014. Wind added 62GW and photovoltaics 56GW. More modest amounts were provided by biomass and waste-to-power, geothermal, solar thermal and small hydro.
In 2015, more attention was drawn to battery storage as an adjunct to solar and wind projects and to small-scale PV systems. Energy storage is of significant importance as it is one way of providing fast-responding balancing to the grid, whether to deal with demand spikes or variable renewable power generation from wind and solar. Last year, some 250MW of utility-scale electricity storage (excluding pumped hydro and lead-acid batteries) was installed worldwide, up from 160MW in 2014.
Additional energy generating capacity, 2015:
Renewables (excl. large hydro) 134 GW
Large Hydro: 22 GW
Nuclear: 15 GW
Coal-fired: 42 GW
Gas-fired: 40 GW
Annual global investments in renewable energy ($US):
$286 billion (2015)
$273 billion (2014),
$234 billion (2013),
$257 billion (2012),
$279 billion (2011),
$239 billion (2010),
$179 billion (2009),
$182 billion (2008),
$154 billion (2007),
$112 billion (2006),
$73 billion (2005)
$47 billion (2004)
12 year total:
$2.3 trillion (unadjusted for inflation)
Developing countries on the rise led by China and India
In 2015, for the first time, investments in renewable energy in developing and emerging economy nations ($156 billion, up 19 per cent compared to 2014) surpassed those in developed countries ($130 billion, down 8 per cent from 2014).
Much of these record-breaking developing world investments took place in China (up 17 per cent to $102.9 billion, or 36 per cent of the world total).
Other developing countries showing increased investment included India (up 22 per cent to $10.2 billion), South Africa (up 329 per cent to $4.5 billion), Mexico (up 105 per cent to $4 billion) and Chile (up 151 per cent to $3.4 billion).
Morocco, Turkey and Uruguay all joined the list of countries investing more than $1 billion.
Overall developing country investments last year were 17-times higher than in 2004.
Among developed countries, investment in Europe was down 21 per cent, from $62 billion in 2014 to $48.8 billion in 2015, the continent’s lowest figure for nine years despite record investments in offshore wind projects.
The United States was up 19 per cent to $44.1 billion, and in Japan investment was much the same as the previous year at $36.2 billion.
The shift in investment towards developing countries and away from developed economies may be attributed to several factors: China’s dash for wind and solar, fast-rising electricity demand in emerging countries, the reduced cost of choosing renewables to meet that demand, sluggish economic growth in the developed world and cutbacks in subsidy support in Europe.

Still a long way to go
That the power generation capacity added by renewables exceeded new capacity added from conventional sources in 2015 shows that structural change is under way.
Renewables, excluding large hydro, still represent a small minority of the world’s total installed power capacity (about one-sixth, or 16.2 per cent) but that figure continues to climb (up from 15.2 per cent in 2014). Meanwhile actual electricity generated by those renewables was 10.3 per cent of global generation in 2015 (up from 9.1 per cent in 2014).
“Despite the ambitious signals from COP 21 in Paris and the growing capacity of new installed renewable energy, there is still a long way to go,” said Prof. Dr. Udo Steffens, President of the Frankfurt School of Finance & Management.
“Coal-fired power stations and other conventional power plants have long lifetimes. Without further policy interventions, climate altering emissions of carbon dioxide will increase for at least another decade.”
The recent big fall in coal, oil and gas prices makes conventional electricity generation more attractive, Dr. Steffens added. “However, the commitments made by all nations at the Paris climate summit in December, echoing statements from last-year’s G7 summit, require a very low- or no-carbon electricity system.”
Related News


Half of Africa’s nations advancing climate solutions to front burner in national development plans: report
The African Development Bank (AfDB) has released Financing Change: the AfDB and CIF for a Climate-Smart Africa, its 2015 Annual Report for its Climate Investment Funds (CIF) portfolio.
The report demonstrates that by the end of 2015 through its AfDB-supported CIF portfolio, 27 African nations – half of Africa – had become engaged in various aspects of climate solutions, and through 39 pilot programs are embedding them in their national development economic and social goals. The work is also significant institutionally for AfDB because it serves as a critical support in shifting the Bank’s core work to fulfill its ambitious goal to triple climate financing for Africa by 2020.
“Since the December climate summit in Paris, the global climate finance architecture has entered a new era,” stated Kurt Lonsway, Head of AfDB’s Climate Change and Environment Division and CIF Coordinator.
“In line with those global commitments, the Bank itself is going through a transformation under the new leadership of Akinwumi Adesina, who became our President in September 2015; and our evolving work with countries through the CIF has been essential to carving our path toward effective support for climate-smart development. Through our CIF work, we have helped Africa’s middle-income and poor countries redefine their approach to economic and social development through programs and projects which are not only based on climate solutions but are also bankable, help change markets, engage a wide swath of stakeholders, and have a core of long-term sustainability. We see this as a crucial change for the future, not only for the continent, but for our planet.”
The report spells out three evolving developments during 2015 that helped catalyze the portfolio’s advancement.
First, by end-December half of the 54 countries in Africa had signed up to run 39 CIF pilots – some with pilots in multiple CIF programs. There are now 5 middle-income countries and one region committed to pilots for renewable energy, 11 forest-rich countries running pilots to build sustainable forest sectors, 9 climate-vulnerable countries committed to resilience programs, and 14 low-income countries committed to transforming renewables.
Second, with multiple CIF programs and a growing stream of climate finance sources, countries are looking to synergize programs and create cross-collaboration. For instance, the document reports that in Uganda and Rwanda, combining their CIF forest and resilience program missions has created the opportunity to recognize key issues such as drivers of deforestation and landscape management across both programs, enabling the resulting CIF investment plans to potentially address the full value chain. In addition, some countries are also looking to work with development partners and other funds such as the Green Climate Fund (GCF) and Global Environment Facility (GEF) to ensure that investment pipelines include programs that can be funded from different sources.
Finally, the report demonstrates the portfolio’s importance for bolstering AfDB’s institutional development efforts, providing additionality in the AfDB core portfolio. The unique CIF working model has helped open doors for innovative approaches and has helped AfDB restructure its support to Africa in a climate-smart way.
Some expected results shown in the report include:
-
in CTF approved projects: 2.13 million tons of CO2 emission avoided per year;
-
in SREP pilots: significant annual increase in electricity from renewables;
-
in PPCR approved projects: a measure of gender balance; and
-
in FIP: 204,000 hectares of sustainably managed forest in Burkina Faso.
» Download: Financing Change: the AfDB and CIF for a Climate-Smart Africa (PDF, 4.84 MB)
Established in 2008, as one of the largest fast-tracked climate financing instruments in the world, the $8.3 billion Climate Investment Funds (CIF) provides developing countries with grants, concessional loans, risk mitigation instruments, and equity that leverage significant financing from the private sector, MDBs and other sources. Five MDBs – the African Development Bank (AfDB), Asian Development Bank (ADB), European Bank for Reconstruction and Development (EBRD), Inter-American Development Bank (IDB), and World Bank Group (WBG) – implement CIF-funded projects and programs.
Related News


DG Azevêdo praises work of standards committee on reaching 500th trade concern
WTO members raised the 500th specific trade concern at a meeting of the Committee on Technical Barriers to Trade on 8-10 March 2016, marking a milestone in their discussions about product regulations and standards. Director-General Roberto Azevêdo qualified this work as “essential to avoid concerns escalating into disputes and to keep trade flowing.”
DG Azevêdo said: “Today WTO Members discussed the 500th specific trade concern. It sounds technical but actually this is about dealing with all sorts of real-life issues that we all care about – from the use of chemicals in toys to the sugar, salt and fat content of our food. The WTO provides a forum for members to raise and resolve these concerns thereby avoiding them escalating into disputes. This is the unseen but essential daily work that keeps trade flowing – and it can only be done through the WTO.”
Specific trade concerns – food and drinks in focus
The Technical Barriers to Trade (TBT) Committee gives WTO members an opportunity to discuss each other’s product regulations and standards and the impact these have on companies and consumers. These discussions are called “specific trade concerns” – STCs for short.
According to WTO rules, members can regulate their products to protect consumer safety and health, but they need to do it in a way that does not make trade in these products unnecessarily burdensome. This preliminary discussion may contribute to avoid trade frictions from reaching the WTO’s Dispute Settlement Body (DSB). Since 1995, less than 2 per cent of STCs discussed in the TBT Committee have become trade disputes.
Breakdown of the main product groups addressed in STCs during 2015:

Source: WTO
Following the trend from 2015, STCs on food and drink regulations were at the top of the agenda of this meeting. Among the eleven new trade concerns raised, seven related to food and drinks. In total, 60 specific trade concerns were raised. The full list of STCs is here.
New STCs addressed at the meeting include:
-
Alcohol: Members discussed two new STCs on India’s draft food safety and standards regulation on alcoholic beverages, and South Africa’s amendment to regulations for health messages on labels of alcoholic beverages. Eight members (Australia, Canada, Chile, the European Union (EU), Guatemala, Japan, the United States (US) and New Zealand) questioned the consistency of India’s requirements with international standards and practices of the International Organisation of Vine and Wine (OIV) and the CODEX Alimentarius Commission, such as with respect to compositional requirements and alcohol content limits for beer, wine and spirits. Members said these new requirements could prevent certain alcohol products from being placed on the Indian market. India said it would consider members’ concerns in the finalization of the regulation.The EU and Canada supported South Africa’s objective of reducing the harmful use of alcohol, but expressed concerns about the changes to alcohol regulations requiring manufacturers to use seven different health warning labels during a twelve-month cycle. South Africa emphasized the importance of reducing the harmful use of alcohol for public health, and said that a public consultation was conducted on the regulation and all comments received were considered.
-
Infant formula: Two new STCs were raised on infant formula; the first regarding China’s infant formula registration requirements, and the second on Thailand's draft act on marketing and promotion of food for infants and young children.
The EU, Japan, Korea, and New Zealand voiced concerns about China’s requirements that would limit the number of infant formula products that a company could register to nine recipes, and three product lines. Members questioned the rationale for these limits, and asked about possible duplication with existing registration requirements. China said that the comment period on the notification of this regulation closed a few days before the meeting, and that the concerns of members would be brought back to Beijing for discussion.
While the US expressed strong support for Thailand's efforts to ensure that marketing of infant formula did not negatively impact breastfeeding, it asked about the scientific explanation for Thailand's proposed ban on marketing and advertising of follow-up formula intended for children up to 36 months of age. Thailand said this measure had recently been notified to the WTO, and that it would forward the US comments to the Thai Ministry of Public Health for consideration.
Information sharing via thematic sessions
Members launched the work programme for 2016-2018 (agreed in the Seventh Triennial Review) by discussing how they are working with each other in their Regional Trade Agreements and Free Trade Agreements to reduce barriers to trade from testing and certification, as part of their work on conformity assessment procedures. The Committee heard presentations about developments in the Trans-Pacific Partnership (TPP) – concluded on 5 October 2015 by 12 countries – the Southern African Development Community (SADC) and the Association of Southeast Asian Nations (ASEAN), as well as bilateral arrangements in the EU-Canada Comprehensive Economic and Trade Agreement (CETA), EU-Korea FTA, Switzerland-China FTA, China-New Zealand FTA, and China-Korea FTA. Members also shared their experiences in using international and regional schemes for conformity assessment to facilitate trade, such as: the IECEE CB Scheme; OECD Good Laboratory Practice (GLP) and Mutual Acceptance of Data (MAD); OIML Mutual Acceptance Arrangement; ILAC/IAF; UNECE type approval certificates for motor vehicles; and the Pharmaceutical Inspection Co-operation Scheme (PIC/S).
Members also discussed how they use regulatory impact assessments (RIAs) to assess the impact that regulations have on trade. Five Members (Korea, China, US, Australia and EU) shared their approaches, and the Organization for Economic Cooperation and Development (OECD) explained their work on regulatory policy and governance. Some main points were the importance of public consultations, methodologies for identifying and assessing the trade impacts of regulation in RIAs, and which regulations should be subject to RIA.
Annual Review of the TBT Committee
The Committee completed its 21st annual review, which reports on its 2015 activities. During the previous year, notifications decreased by 12% compared to 2014 (to a total of 1,989 notifications). Nevertheless, the trend since 2005 has been an upward one driven increasingly by developing members. In 2015, developing Members continued to submit significantly more new notifications than developed members – also the number of notifications from LDCs increased during the year. A total of 37 technical assistance (TA) activities on TBT were organized by the WTO in 2015, and TBT-related TA activities are in high demand by WTO members.
TBT notifications by WTO members, 1995-2015:

Developments in observer organizations to the TBT Committee
-
The United Nations Economic Commission for Europe gave an update on the 25th session of the Working Party on Regulatory Cooperation and Standardization Policies, which adopted a revised recommendation for the “International Model for Transnational Regulatory Cooperation Based on Good Regulatory Practice”.
-
The African Organisation for Standardisation (ARSO) – which received ad hoc observer status at the November meeting – presented its work to promote implementation of the TBT Agreement in Africa, including through technical assistance.
-
The International Standards Organization (ISO) introduced its new ISO Action Plan for developing countries, a technical assistance programme launched in January, which focuses on strengthening the national quality infrastructure of ISO members.
-
The International Electrotechnical Commission (IEC) announced Uzbekistan's recent membership. They also introduced their cooperation work with the National Metrology Institute in Germany (PTB Germany) through capacity-building events, including one recently held in Tashkent, Uzbekistan.
-
The African, Caribbean and Pacific Group of countries gave an update on capacity-building and technical assistance initiatives on TBT-related matters in Geneva.
-
The International Electrotechnical Commission (IEC) reported on the Africa Smart Grid Forum held in Cairo on 5-7 March, and presented the work of the IEC Africa Regional Center (IEC-AFRC) in Nairobi, Kenya.
-
The World Health Organization (WHO) presented its recent work on nutrition labelling, including development of guiding principles and a guidance framework manual to support countries in implementing effective front-of-pack labelling systems.
-
The International Organization of Legal Metrology (OIML) announced the launch of on e-learning training programme for metrology aimed at developing countries.
-
The CODEX Alimentarius said that the absence of Codex guidance on a topic does not automatically mean that a measure adopted by a WTO member is not in line with Codex. The representative also gave updates on the work of CODEX.
The full list of observer organizations working with the TBT Committee is here.
Next meeting
14-16 June: TBT Committee regular and informal meetings – delegations will continue discussions on standards and commence an exchange in the area of regulatory cooperation.
Related News


New trade concerns reviewed by WTO committee on food safety and animal/plant health
WTO members reviewed a number of trade measures concerning food safety and animal and plant health at a meeting of the Committee on Sanitary and Phytosanitary (SPS) Measures on 16-17 March. Nigeria and Mexico reported they have resolved frictions over plant health certificates.
New trade concerns
The committee reviewed a number of new concerns about WTO members’ trade measures, including five relating to animal health.
South Africa’s livestock certificates
Namibia, Swaziland and Botswana questioned South Africa’s revised animal health requirements for exports of cattle, sheep and goats. They claimed that the new requirements would limit livestock exports to South Africa and significantly impact the livelihood of small-scale farmers. South Africa said that the objective of the measures is to align the standards with applicable international guidelines, and that it had held bilateral discussions to resolve concerns with its trading partners.
China’s import restriction on EU animal products
The European Union questioned China’s measures limiting imports of animal products. China has suspended imports of bovine products and genetic materials from the EU since 2012, due to concerns about the Schmallenberg virus, a disease infecting sheep, cattle and goats. The EU argued that China’s import bans are unjustified since the disease is well under control and poses minimal risks. China responded that its experts had conducted risk assessments and concluded the virus can easily spread across regions, and therefore trade restrictions cannot be limited to exports from certain areas. As no international standards are in place for the Schmallenberg virus, China argued that its import restriction is in line with the WTO SPS Agreement.
The EU questioned China’s import restriction on poultry imports due to a particularly deadly strain of bird flu – highly pathogenic avian influenza (HPAI). The EU argued that China’s country-wide import ban ignored the fact that HPAI is only present in a few regions. In response, China argued that since certain types of HPAI have never been detected in its territory, its precautionary measures aim to prevent the disease from entering the country. China expressed its intention to continue dialogue with the EU to resume bilateral trade.
Import restrictions on Brazilian meat
Brazil questioned the EU’s import ban on pig meat from the state of Santa Catarina. It said that despite its efforts to comply with EU standards on residues of ractopamine, a feed additive that boosts growth and promotes leanness in pigs and cattle, the EU still claimed that its maximum residue level was exceeded. Brazil questioned the EU’s method for testing the residue at issue and urged the EU to lift the restrictions.
Separately, Brazil raised concerns about Nigeria’s import ban on beef and poultry products. According to Brazil, Nigeria had prohibited all imports of frozen meat since 2007 due to deficiencies in the Nigerian refrigeration system. Nigeria responded that the treatment is applied to all WTO members, and it is currently reviewing its practices.
Issues previously raised
EU’s work to define endocrine disruptors
A heated debate once again took place on the EU’s proposed roadmap to define criteria to identify "endocrine disruptors" – chemical substances that may affect the human hormone system at certain doses. Twenty-three WTO members expressed concerns on proposed EU regulations. These concerns centre around the adverse trade effects on exports of agriculture products from developing countries. Many members pointed out that the proposed method based on the detection of a chemical substance, rather than assessing the risks to human and animal exposure, is overly restrictive. The EU informed members that the results of its risk assessment will be ready by the summer, and will take into consideration trade effects in formulating its policy measures.
African swine fever
African swine fever (ASF), a highly contagious disease of pigs currently reported in Eurasia, again featured heavily in the agenda. Russia questioned if the EU’s measures to contain the spread of ASF were sufficient, to which the EU responded that it would not engage in a debate on the matter since it is also currently the subject of an on-going dispute settlement case (DS475).
Separately, the EU questioned China and Korea’s import restrictions due to ASF. Both said their restrictions aim to prevent ASF from entering their territories, and they are willing to speed up risk assessment.
EU’s new regulation on novel foods
The EU made a presentation on its new regulation to approve novel foods, which will take effect in 2018 and ease the procedure for approval of foods not sold in the EU before 1997. But several members – Peru, Colombia, and Guatemala – said the new regulation does not address developing countries’ trade concerns regarding traditional products.
Resolved issues
Some trade concerns previously raised at the meeting were reported to be resolved. Nigeria informed members it had resolved trade frictions with Mexico about delays in exports for hibiscus flowers, a plant commonly used in beverages. Mexico previously required verification of plant health certificates for consignments of hibiscus flowers from Nigeria, resulting in delays of up to six weeks. At the previous meeting, Nigeria indicated its intention to start a mediation process to resolve the trade concern. Both countries reported they have resolved the issue bilaterally.
More information on all SPS-related measures and trade concerns previously discussed in the committee can be found in the SPS information management system.
Over 400 trade concerns so far
A key function of the SPS committee is to provide a forum for countries to exchange information on their SPS activities and trade measures so any trade restrictions do not go beyond what is needed to protect human, animal and plant health.
The committee has reviewed over 400 trade concerns since 1995, of which 31% relate to food safety, 25% relate to plant health, 39% relate to animal health, and 5% to other issues such as certification requirements, control or inspection procedures, according to the annual summary report (download below) of all the trade concerns reviewed in the SPS committee.

And finally…
Delegates paid tribute to Gretchen Stanton, who chaired negotiations on the SPS Agreement and who served as the Secretary of the committee for over 20 years. Ms Stanton will retire from the WTO after 31 years of service at the end of the month.
Additional downloads
-
Update on the Standards and Trade Development Facility | 25 February 2016
-
SADC Report to the World Trade Organisation Sanitary and Phytosanitary Committee Meeting on SPS Activities | 7 March 2016
-
Information from the African Union Commission | 8 March 2016
-
Activities of the Europe-Africa-Caribbean-Pacific Liaison Committee | 9 March 2016
-
ACP-EU TBT Programme Report to the Meeting of the WTO SPS Committee | 9 March 2016
- Report (2015) on the activities of the Committee on Sanitary and Phytosanitary Measures | 23 October 2015

