Search News Results
EALA set to pass Omnibus Law on Integration
The East African Legislative Assembly has proposed enactment of an omnibus law to harmonise national laws appertaining to the Community and to institute an administration law for the Common Market Protocol.
The Assembly is of the view such a move shall cure, existing challenges of harmonisation of Partner State laws appertaining to the Community. At the same time, the Assembly wants the Council of Ministers to direct the Sectoral Council on Legal and Judicial Affairs to hold regular meetings and to prioritize harmonisation of laws for EAC in order facilitate integration within the set time frames.
In order to meaningfully facilitate co-operation in legal and judicial affairs as provided for under Article 126 of the Treaty, EALA urges EAC Council of Ministers to expedite implementation of the entire Article which obliges Partner States to harmonise legal training and certification; encourage standardisation of judgments of courts within the Community as well as in establishing common syllabus for the training of lawyers.
Late on Wednesday, EALA approved the Report of the Committee on Legal Rules and Privileges on the oversight activity on the harmonisation of national laws in the EAC context. The Report presented to the House by Hon. Dora Byamukama on behalf of the Chair of the Committee, Hon. Peter Mathuki, follows an oversight activity carried out by the Committee in February 22-26, 2016.
Chapter 24 of the Treaty provides for co-operation in Legal and Judicial Affairs. Specifically, Article 126 (2) (b) of the Treaty provides that “Partner States shall through their appropriate national institutions take all necessary steps to harmonise all their national laws appertaining to the Community”.
In line with that Treaty provision, EAC Partner States established a sub-committee on the approximation of national laws in the EAC context.
During the oversight activity, the Committee was informed that Partner States are at different stages of implementation of the directives of the Council of Ministers on harmonisation on national laws. It further observed that Partner States were slow when it comes to amending laws to comply with the directive of the Council of Ministers pertaining to harmonisation of national laws. Further on, the criteria used and timelines for harmonisation of laws is also unclear.
The Committee cites a number of challenges including frequent changes in the membership of the Task Force, conflicting commitments of members of the Task Force as well as different legal systems. In addition, the slow pace in the implementation of the harmonisation agenda at national level and the lack of monitoring mechanisms to ensure Partner States comply with the adopted approximation proposals are also cited.
During debate time, Hon. Judith Pareno said the activity of harmonising and approximating laws was a Treaty matter and said it was important for the Community to have a system of the laws to harmonise. Hon. Shyrose Bhanji remarked that slow implementation of harmonising laws was retrogressive for integration. She asked the House to request the Council of Ministers to share with the Assembly a matrix showing progress of implementation.
“We also need a special strategy to popularise the laws passed by the Assembly to the citizens,” Hon. Bhanji said. Hon. Martin Ngoga called for a rethink of strategy in the way the Community undertakes its mandate as it advances the objectives of integration. Harmonisation of laws is just one of the ways but there are a number of things we need to do with reference to Article 126.
“Why are we not publishing East Africa Law Journals? There are over 600 laws that we need to harmonise to make EAC realise the Common Market and we must move faster,” he said. The legislator said EALA must take the lead.
“It is the Assembly’s role to make laws and we should not take back the matter to Partner States,” he said. “We must reassess our mode of work,” he added.
Hon. Susan Nakawuki remarked that it was key for the harmonisation of immigration laws to be speedily undertaken. “One of the key issues we need to address is that of the yellow fever certificates and I request the Council of Ministers to inform us of the position of the Community on the matter,” Hon. Nakawuki said.
Chairperson of the Legal Rules and Privileges Committee, Hon. Peter Mathuki urged the Ministers of EAC to be in attendance during the Plenary Sitting. “The continuous absence of EAC Ministers may be another reason for the slow implementation of activities of integration,” Hon. Mathuki said. The legislator also said bureaucracies needed to be reduced.
The 3rd Deputy Prime Minister and Minister for EAC in the Republic of Uganda, Rt Hon. Kirunda Kivejinja remarked that progress on the pillars of integration were notable while, the Deputy Minister for Foreign Affairs, East African, Regional and International Co-operation, Hon. Dr Susan Kolimba remarked that the Council of Ministers was committed to ensuring issues brought to fore by Members are adequately addressed.
Also rising up to support the report were Hon. Joseph Kiangoi, Hon. Abdullah Mwinyi and Hon. Valerie Nyirahabineza.
Related News


Mobile money: Lessons for West Africa
The mobile money financial services industry is now expanding rapidly in the West African sub-region after its phenomenal growth in East Africa. Experiences of East and Southern African countries confirm that mobile money presents a unique opportunity to encourage and enhance financial inclusion, formalise the informal sector, and tap into the domestic savings in rural areas, with a potential to raise economic growth.
At the same time, central banks also recognise that principles governing the sector must be carefully and deliberately managed in order to protect customers while at the same time not creating additional barriers to entry or costly operations for mobile money operators that might stifle the industry and limit its potential.
Much can be learned about this regulatory balance between policies encouraging both growth of the sector as well as consumer protection from case studies, mainly in East and Southern Africa, of countries that are years ahead of West Africa in terms of the widespread introduction of mobile money in the marketplace. In some cases such as Kenya, relaxed regulatory regimes have led to a flowering of mobile money, with its deep penetration and improved economic outcomes through access to financial services for the poorest. On the other hand, strict regulations in some countries have hampered the ability of mobile money operators to enter the market and sustain operations at a low cost, limiting the degree of financial inclusion achieved through mobile money.
Recognising that Sierra Leone and the West African region in general is 5-10 years behind countries like Kenya in this sector, the experience of these countries over the past decade (rather than their current situation) can inform the regulatory and macroeconomic challenges West Africa is facing now and will face in the coming years as the mobile money sector grows. Lessons and evidence from case studies in East and Southern Africa can provide options to answer some of the pressing questions facing the Bank of Sierra Leone and other central banks in the West African region. West African countries can also look to diversity within the region to identify best practices and opportunities for regional collaboration.
Sub-regional Workshop on Mobile Money in West Africa
March 14th-16th, 2016, Bank of Sierra Leone Recreational Complex, Freetown, Sierra Leone
This workshop – jointly organised and supported by the Bank of Sierra Leone (BSL) and the International Growth Centre (IGC) offices in Sierra Leone, Liberia, and Ghana – aimed to achieve this experience sharing and learning across sub-Saharan Africa. The workshop brought together government and private sector representatives from Gambia, Ghana, Guinea, Liberia, Nigeria, and Sierra Leone, and builds on previous SSA meetings over the past two years in Mozambique and Senegal. Through this workshop, BSL hopes they and other central banks in the region can take the next step towards advancing their new guidelines as well as look at new areas such as credit services through mobile money. Key emerging policy areas were identified for workshop sessions to address, and the IGC identified relevant economic questions that can be addressed by the SSA experience.
The workshop addressed the following topics:
-
Research Results: Much research has been done on the implications of mobile money, particularly in terms of facilitating financial inclusion, including: spreading risk and consumption, and the importance of credit and savings to achieve this (Billy Jack); implications for monetary policy (Sebastian Walker & Chris Adam); impact on inflation and productivity (Janine Aron); and uses of big data generated through mobile money for informing policy. The workshop will review these and other areas.
-
Policy/Regulation: The growth of mobile money presents challenges for the formulation and reform of policies that encourage its use for improving financial inclusion, while ensuring customer protection through appropriate market and financial regulations, without distorting financial markets. The different choices of East African countries – such as Kenya with low regulation and high inclusion leading to higher development impacts as research suggests, and Mozambique with more regulation and less inclusion – can help illustrate the implications and policy trade-offs.
-
Programmes: The potential uses of mobile money, such as for salary payments to government workers, payments for public services or taxes, and regulation of informal workers through mobile money salary payments, are opportunities for improving service delivery and promoting the wider development agenda of these countries. The landscape for mobile money in the coming years will be shaped by policy decisions on the nature and scope of its use. At this early stage in its evolution, the experience of countries in East and Southern Africa can help participating countries outline recommendations on various programme areas and define relationships among the banking, telecom, and non-banking financial services sectors to prepare for the optimal use of the instrument.
-
Country priorities for policy: The following areas have been identified as key questions facing central banks in the region, which the workshop proposed to address at country sessions:
-
Lending and credit for mobile money providers
-
Earning interest on a mobile money account/trust account for non-bank led operators
-
Partnerships with telecoms regulators, and cooperation between banks and telecoms
-
Regional considerations and cooperation
-
Customer protection & empowerment through financial literacy
-
Regulations governing agent networks
-
Capital requirements for mobile providers
-
Taxation on transactions and on salary payments for the informal sector
-
International remittances
Presentations from the workshop are available to download below.
Related News


Does trade reduce poverty? A view from Africa
Although trade liberalization is being actively promoted as a key component in development strategies, theoretically, the impact of trade openness on poverty reduction is ambiguous.
On the one hand, a more liberalized trade regime is argued to change relative factor prices in favor of the more abundant factor. If poverty and relative low income stem from abundance of labor, greater trade openness should lead to higher labor prices and a decrease in poverty. However, should the re-allocation of factors be hampered, the expected benefits from freer trade may not materialize. The theoretical ambiguity on the effects of openness is reflected in the available empirical evidence.
This paper examines how the effect of trade openness on poverty may depend on complementary reforms that help a country take advantage of international competition. Using a non-linear regression specification that interacts a proxy of trade openness with proxies of various country structural specificities and a panel of 30 African countries over the period 1981-2010, we find that trade openness tends to reduce poverty in countries where financial sectors are deep, education levels high and institutions strong.
Introduction
Most economists accept that, in the long run, open economies fair better in aggregate than do closed ones, and that relatively open policies contribute significantly to development. Many commentators fear, however, that in the shorter run, one of the steps towards openness – trade liberalization – harms the poorer actors in the economy, and that even in the longer run successful open regimes may leave some people behind in poverty. Africa remains the poorest continent of the world. Yet, at the same time, African countries have experienced significant improvements in trade liberalization. It seems that the large gains expected from opening up to international economic forces have, to date, been limited in Africa, especially for poor people.
While the traditional trade theory predicts welfare gains from openness at the country level through specialization, investment in innovation, productivity improvement, or a better resource allocation, the theoretical impact of trade on the poor remains uncertain. Besides, empirical results do not converge on this point and it seems that developing countries are not equally able to make use of the opportunities arising out of increased access to markets in the developed world.
The contribution of this paper lies in providing new cross-country empirical evidence focused on Africa on how the poverty reduction effect of greater trade openness depends on a variety of structural characteristics, including some that are subject to reform. Using a panel of African countries over the period 1981-2010 and testing for non-linearities in the trade-poverty relationship, this paper explores the empirical link between trade openness and poverty. Its results uncover an interesting pattern of reform complementarity: trade openness tends to reduce poverty in countries as their financial sector grows deeper, their education level higher and their institutions stronger.
Our concern is with poverty, not inequality. Since trade liberalization tends to increase the opportunities for economic activity, it can very easily widen income inequality while at the same time reduce poverty. Consequently, statements about its effects on inequality cannot be translated directly into statements about its impact on absolute poverty. There may be sound positive and normative reasons for interest in inequality, but they are not the concerns of this paper.
Related News


tralac’s Daily News Selection
The selection: Thursday, 17 March 2016
Starting today, in Lilongwe, the 22nd Meeting of the Intergovernmental Committee of Experts. The theme: ‘Financing the SADC Industrialization Strategy and Roadmap’.
Launching today, in Luanda: the Angola-China Chamber of Commerce
Today, in Cape Town: a briefing on the post-Nairobi work programme, by Minister Rob Davies and WTO DG Roberto Azevedo
Roberto Azevêdo: 'WTO’s record boosts its hand in talks' (Business Day)
Members have decided to reflect on how these differences might be overcome and how we might move the WTO agenda forward. The good news is that all members support the notion that we need to continue work on the Doha issues — agriculture, manufactured goods, services and fishery subsidies among them. And all members have again committed to maintaining development at the very heart of the WTO’s work. This is an opportunity to ensure that the future path of global trade talks serves SA’s development goals. I am visiting SA this week to discuss these issues.[Roberto Azevêdo: 'WTO is delivering for Lesotho' (WTO)]
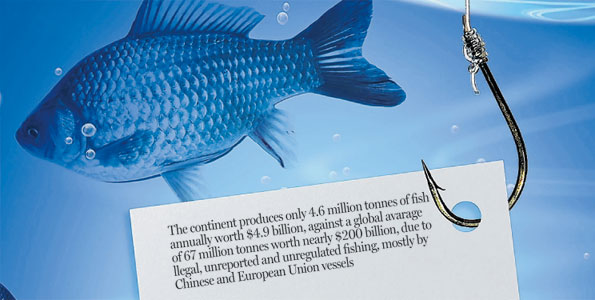
Illegal fishing hurting continent’s fisheries (The EastAfrican)
The United Nations Food and Agriculture Organisation estimates the global marine fishing industry produces some 67 million tonnes of fish annually worth between $100 billion and $200 billion. Africa’s coastal waters produce only 4.6 million tonnes of fish annually, valued at $4.9 billion. However, 52% of the fish stock is fully exploited, 8% is depleted, 19% overexploited while 1% is recovering from depletion, data from both the FAO and the AU-IBAR shows. Key to the near collapse of the continent’s fisheries is the illegal, unregulated and unreported fishing, which costs the continent billions of dollars in lost revenue. The World Bank’s Africa Programme for Fisheries reports that some 11-26 million tonnes of sea food is caught illegally every year, worth between $10 billion and $23.5 billion. The West African coast is said to be the most affected by illegal fishing, with 40% of total catches falling in that category. [Improving Africa's maritime policies (ISS)]
Breaking out of enclaves: leveraging opportunities from regional integration in Africa to promote resource-driven diversification (CCSI)
This report explores the relationships between extractive resources, regional integration, and economic diversification. It looks at how regional approaches can increase the local employment and production effects of extractive resources projects. It discusses the regulatory, institutional, and political economy barriers facing African policymakers in achieving regional cooperation. The analysis makes frequent reference to three case studies of efforts to create trans-boundary transport corridors, including the Nacala corridor in southern Africa, proposals for the exploitation of iron ore in Guinea and Liberia, and the LAPSSET corridor in East Africa to ship oil and gas from South Sudan to ports on the Indian Ocean. [Download] [The authors: Gözde Isik, Kennedy O. Opalo, Perrine Toledano]
Corridors, clusters, and spatial development initiatives in African agriculture: workshop report (ECDPM)
The workshop brought together some of the key institutions and researchers that are active on this topic both from within and outside the CGIAR, with the objectives of understanding the current state of thinking in research and policy circles, and to help define how best the ISPC might contribute through its strategic study on corridors and spatial development initiatives in African Agriculture.
Kenya, Uganda, Rwanda to start joint electronic cargo tracking in June (Business Daily)
“By June 2016, goods moving along the northern corridor (Mombasa-Kigali) will be monitored in real time, curbing dumping, theft and other vices,” Uganda Revenue Authority said in an update. Kenya and Uganda have successfully piloted the ECTS while Rwanda has commenced trials and targets to fully adopt the system by mid this year. South Sudan is also expected to come on board soon following in the wake of its recent admission as the sixth member of the East African Community (EAC). “The southern corridor (Dar-es-Salaam-Bujumbura) is expected to be monitored by a similar system,” said URA's Mr Kateshumbwa. [How ICT-driven concept can boost Africa’s trade ranking (Leadership)]
Mining investment and governance review (World Bank)
By June 2016, MInGov will have completed and published assessments of nine countries using a consistent, measurable, comparable and actionable methodology. These country assessments will include seven in Africa, one in Latin America and one in Asia. Through the collection and analysis of a unique and comprehensive dataset, the Mining Investment and Governance Review (MInGov) presents an objective assessment of the mining sector of several countries. It offers actionable avenues for reform, supports transparency, and informs investment decision-making and debate among interested stakeholders. [From resource curse to rent curse in the MENA region (AfDB)]
ZimTrade calls for trade balance with SA (The Herald)
Zimtrade said yesterday South Africa must increase access to its markets by Zimbabwean companies to improve trade between the two neighbouring countries. Zimtrade chief executive Sithembile Pilime told participants at the Zimbabwe-South Africa trade and investment conference that this should be done to realise a fair trade balance. At present, the trade balance is heavily skewed in South Africa’s favour. In 2012 South Africa enacted the Preferential Procurement Policy Framework Act which stipulates that 75% of procurement should be local in an effort to protect South African manufacturers. The measure by South Africa, which is Zimbabwe’s largest trading partner, has severely impacted on local firms which are struggling to recover from a decade long economic meltdown.
Related: South Africa minister urges Zim businesses to use rands (NewsDay), SA pumps R20bn into Zimbabwe (Chronicle)
Zimbabwe expecting IMF loan in 3rd quarter (The Herald), SADC endorses candidature of Zimbabwean minister for UNWTO post (StarAfrica), Zimbabwe facing worst malnutrition rates in 15 years (UNICEF)
Banning ‘mitumba’ will certainly not revive the local textile industry (Daily Nation)
The textile industry in Kenya failed because it did not adapt to changing circumstances. Serious questions beg answers. For example, why do the export processing zones in Kenya produce high quality clothing for export under the African Growth and Opportunity Act framework only? If East Africa was to give similar tax exemptions for local clothing sold locally, would the benefit of job creation be greater than the foregone tax? Why do khanga (leso) factories in Morogoro, Tanzania, continue to survive despite the onslaught from mitumba and China? Why does the leading shoe producer in Kenya import shoes from India and brand them for local sale?
Ghana: Govt to restrict cement imports from Nigeria, China (Daily Trust)
Africa's leading cement manufacturer, Dangote Company and other cement importers are in for tougher times in Ghana, following plans by government to restrict cement imports into the country. To this end, the Minister of Trade and Industry, Dr. Ekwow Spio-Garbrah, has proposed to the parliament, the enactment of an Act "to propose a ceiling on the annual importation of cement into Ghana." Ghana has a production capacity of about 9 million metric tonnes per year, while national consumption is below 6 million; thus leaving an excess of about 3 million metric tonnes per annum. [We can’t let China destroy Nigeria’s economy - President of Manufacturing Association (CNBCAfrica)]
Portugal exports less to Angola in 2015 (MacauHub)
Portuguese financial newspaper Diário Económico cited figures from the National Statistics Institute to show that Portuguese exports to Angola fell by 45% year on year in January 2016. Although there have been political problems and devaluation of the currency in Mozambique, 2015 was not a bad year, and Portuguese exports increased from 318 million euros to 356 million euros, or almost 12% more.
Consumer market outlook in Africa ‘still positive’ (Business Day)
Despite the decline in growth, Africa’s long-term outlook as a consumer market remains positive, says an inaugural report on retail and consumer businesses by professional services network PwC. The report, released on Tuesday, analysed 10 African economies offering appealing opportunities for retail and consumer businesses looking to expand in Angola, Cameroon, Ethiopia, Ghana, Cote d’Ivoire, Kenya, Nigeria, South Africa, Tanzania and Zambia.
Ethiopia: South African companies keen to invest (Ethiopian Herald)
Opening the Ethio-South African Business Forum organized by the Ministry of Foreign Affairs jointly with the Addis Ababa Chamber of Commerce and Sectoral Associations and the Embassy of the Republic of South Africa here yesterday, Industry State Minister Dr. Mebrahtu Meles said that the nation has already created enabling business environment which attracts foreign investment and the variety of agro-ecological zones, abundant natural resources and labor could be utilized as an input for wealth creation.
Magufuli orders ban on any more dubious power deals (IPPMedia)
Eddie B. Mugarura: 'The EAC bureaucracy vs the people' (New Times)
Timely SA-Saudi trade boost for local economy (Cape Times)
SA trade and investment mission to Brazil (dti)
Business leaders, UN Member States and civil society agree: gender equality critical to economic development (UN Global Compact)
Liner shipping: is there a way for more competition? (UNCTAD)
Kenya: Mobile payments up 21% in 2015 (Daily Nation)
Transport companies promise not to ‘knowingly facilitate’ illegal wildlife trade (Container Management)
Nigeria: UNIDO officially opens an investment and technology promotion office
The top 8 active researchers in developing countries according to RePEc (World Bank Blogs)
Imposing, aggressive and unwilling to listen: how South Africans are perceived in Africa (Daily Maverick)
South Africa: Department of Home Affairs overview of 2015 asylum trends (PMG)
tralac’s Daily News archive
Catch up on tralac’s daily news selections by following this link ».
SUBSCRIBE
To receive the link to tralac’s Daily News Selection via email, click here to subscribe.
This post has been sourced on behalf of tralac and disseminated to enhance trade policy knowledge and debate. It is distributed to over 350 recipients across Africa and internationally, serving in the AU, RECS, national government trade departments and research and development agencies. Your feedback is most welcome. Any suggestions that our recipients might have of items for inclusion are most welcome.
Related News


DG Azevêdo: WTO is delivering for Lesotho
WTO Director-General Roberto Azevêdo visited Maseru, Lesotho, on 16 March 2016 to discuss the implementation of recent WTO agreements and how the organization can keep on supporting growth and development in Lesotho in the years ahead.
He met with His Majesty King Letsie III, as well as the Deputy Prime Minister Mothetjoa Metsing, the Minister of Trade and Industry Joshua Setipa, and the Minister of Foreign Affairs Tlohang Sekhamane.
The Director-General said:
“Helping Least Developed Countries (LDCs) like Lesotho to compete and benefit from trade is a central part of our work. In recent years, the WTO has taken further steps in that direction, negotiating new trade deals which can help Lesotho’s economic development.
“For example, the WTO’s Trade Facilitation Agreement will help a more diverse group of companies to export by reducing the time, cost and bureaucracy involved in moving goods across borders. For a landlocked country like Lesotho, this diversification could be particularly important. It is very encouraging that Lesotho has ratified this Agreement, and is now laying the foundations for these benefits to become a reality.
“Further important outcomes were agreed at our Ministerial Conference in Nairobi last December. WTO members delivered a set of decisions which can facilitate opportunities for LDCs’ export of goods and services. In addition WTO members agreed to eliminate agricultural export subsidies. This will help to level the playing field in agriculture markets to the benefit of farmers and exporters in Lesotho and other LDCs. In fact, these negotiations were chaired by Lesotho’s Minister of Trade and Industry, Joshua Setipa, whose able leadership was a big factor in this success.
“Lesotho is a small country geographically, but it has a big voice in the WTO. I look forward to continuing to build our partnership in the years ahead.”
During the visit the Director-General also visited a project which benefits from the support of a WTO-sponsored initiative, the Enhanced Integrated Framework. The project aims to build Lesotho’s capacity to produce and market high value fresh fruit and vegetables.
Related News


Economic emergence is the new target for African countries, but how can it be achieved?
As African countries work towards the goal of achieving economic emergence, Daouda Sembene points out that the key challenge is developing a concrete action plan to shape reform.
While embracing the new Sustainable Development Goals last September in New York, a number of sub-Saharan African leaders were reminded of the painful reality that only their region failed to meet the Millennium Development Goal (MDG) of halving the proportion of people living in extreme poverty by 2015.[1]
As African leaders are increasingly shifting their focus now on achieving economic emergence, away from primarily reducing poverty, they may have to draw lessons from their experience with poverty reduction strategies (PRS) to make sure that the new emergence-inspired era will ultimately enjoy a better fate.
Assuredly, there is a strong sense that emergence plans embody clear indications about what policy and reform agendas need to be implemented. Most emergence strategies in sub-Saharan Africa describe clearly what the government intends to do.
Typically, these are underpinned by broadly similar pillars across the region, including the need to boost strong and inclusive growth, strengthen governance and the rule of law, create jobs, promote private sector development, deepen the financial sector, improve competitiveness, and diversify the economy.
However, while emergence strategies provide an answer to the “what to do” question, they generally miss the “how to do it” question, particularly when it comes to addressing political economy impediments to sustained reforms.
Many candidates for emergence usually fail to spell out in a clear and comprehensive manner specific action plans that can deliver their government’s vision. Besides their other policy documents rarely fill out this gap and when they do, they tend to remain silent about how to overcome existing political economy constraints to reforms.
Yet, this is one of the shortcomings of the PRS approach that must be addressed for emergence to become a reality. Indeed, it is well-known that political economy considerations, notably those related to rent-seeking activities, tend to impede reform implementation. For instance, the literature offers extensive evidence that in sub-Saharan Africa competitive clientelism undermines the quality of policymaking and blocks the conditions for economic transformation and better governance.[2]
While the literature may offer useful guidance, no learning experience could potentially be as effective and rewarding for policymakers as a policy dialogue with peers from countries that coped successfully with such challenges.
That is partly the reason why Senegalese officials, in close partnership with the IMF staff, adopted in the recent past a promising peer-to-peer learning initiative, with a view to implementing their Government’s Plan for economic emergence. This involved crossing over the Atlantic and Pacific oceans, reaching out to peers to draw together lessons from our countries’ respective reform experience.
The latest exercise took place in January 2016 when a delegation of Senegalese officials, accompanied by representatives from the academia, civil society, and the central bank headed to Washington to participate in a book workshop attended by peers from Mauritius, Morocco, and Seychelles, in addition to IMF and World Bank staff. The event provided participants with a platform for exchanging ideas and experience about advancing reform agendas in the face of political economic constraints.
It is expected that the workshop will also be the birthplace of an upcoming publication that will eventually provide Senegal and other countries in similar circumstances with additional insights about how best to shape their reform efforts.
Preliminary indications suggest that peer-learning activities are associated with significant payoffs. It has catalysed reform efforts, offered new insights about reform success, and produced new ways of dealing with old issues, notably related to the political economy of reforms and economic competitiveness.
Therefore, peer-learning bodes well for reform implementation in the country and must be pursued.
Dr Daouda Sembene is a Senior Advisor to Senegal’s Minister of Economy, Finance, and Planning. He is a member of the Boards of Governors of the World Bank and the International Monetary Fund, as Alternate Governor for Senegal.
The views expressed in this blog post are those of the author and do not necessarily reflect those of the Government of Senegal, Africa at LSE blog or the London School of Economics and Political Science.
Daouda Sembene will be speaking at LSE on Thursday 17 March alongside Ali Mansoor and Salifou Issoufou at the event The Political Economy of Change: the Case of Senegal.
[1] According to the MDGs Report released last year by the United Nations, all developing regions had met the target by 2011 except sub-Saharan Africa. Ultimately, the rate of extreme poverty in this region was only projected to be cut by just over a third, from 57 percent in 1990 to 41 percent in 2015.
[2] See Africa Power and Politics Programme et al. (2012). The Political economy of Development in Africa: A joint statement from five research programmes.
Related News


Why regional integration is so important for resource-driven diversification in Africa
Natural resources management, particularly in the extractives industry, can make a meaningful contribution to a country’s economic growth when it leads to linkages to the broader economy. To maximize the economic benefits of extractives, the sector needs to broaden its use of non-mining goods and services and policymakers need to ensure that the sectors infrastructure needs are closely aligned with those of the country’s development plans.
In Africa, especially, mining and other companies that handle natural resources traditionally provide their own power, railways, roads, and services to run their operations. This “enclave” approach to infrastructure development is not always aligned with national infrastructure development plans.
In a continent facing massive infrastructure needs, African countries can thus miss out on opportunities to promote the shared use of infrastructure and to strengthen the linkages between extractive resources and the broader economy. Non-mining businesses like farms or food traders in sparsely populated or remote areas, for example, would benefit from shared infrastructure, since railways, roads and electricity are all needed to bring goods to markets.
Regional integration is often seen as less relevant for resource-rich countries, since demand for commodities typically comes from the global market rather than from regional demand. Regional integration in Africa, however, can play a vital role in diversifying economies away from dependence on the export of just a few mineral products; in delivering food and energy security; in generating jobs for the increasing number of young people; and in alleviating poverty and delivering shared prosperity.
The relationship between resources, regional integration and diversification is twofold.
First: Since resource deposits don’t always fit neatly inside the borders of individual countries and tend to span multiple borders (including landlocked countries), trans-boundary mining transport will need to be built to extract and transport the resources. That often has implications for regional integration. Global experience shows that the development of such infrastructure requires strong cooperation and coordination among all parties involved, along with a legal and regulatory environment that allows for the shared use along that infrastructure. Designing and building such infrastructure and a regulatory environment in a multi-country context is, however, very complex: It involves a wide range of political-economy issues that need to be addressed.
Second: Extractives can help diversify economies through linkages to the broader economy. Regional value chains in minerals and metals, for example, will create demand for services and goods that feed in to that value chain. Regional integration is essential here as well, since goods, services and people need to be able to flow seamlessly across borders to reduce costs and to help firms become competitive enough to link to these value chains. The deeper integration of regional markets through the elimination of non-tariff barriers can reduce trade and operating costs. It can also ease the constraints faced by many firms in gaining access not only to demand for their products but also to the essential services and skills that they need as to boost productivity and diversify into higher-value-added areas.
Deepening regional integration among African economies, therefore, provides both opportunities and challenges to the sound management of extractive resources and translating wealth from these resources in to diversified economies and equitable growth. Our recent report, “Breaking out of Enclaves Leveraging Opportunities from Regional Integration in Africa to Promote Resource-Driven Diversification” explores this nexus of extractive resources, regional integration, and economic diversification.
The report looks at how regional approaches can increase the local employment and production effects of extractive-resources projects and discusses some of the regulatory, institutional, and political economy barriers facing African policymakers in achieving regional cooperation.
The analysis is based on three case studies of efforts to create trans-boundary transport corridors anchored by extractive resources: The cases include the extraction of coal in the Nacala corridor in southern Africa; proposals for the exploitation of iron ore in Guinea and Liberia; and the LAPSSET corridor in East Africa that aims to ship oil and gas from South Sudan to ports on the Indian Ocean. These case studies encompass three different sub-regions that vary in their level of regional integration. They are assessed through a framework that organizes the most important policy questions and leads to a number of concrete recommendations for national and regional policymakers.
Through our research and the recommendations provided in the report, we show that regional integration is still relevant for Africa’s resource-rich countries – and that it is more crucial than ever before for diversifying countries’ economies as the global commodity supercycle comes to an end.
Related News


Illegal fishing hurting continent’s fisheries
The best net is the one that catches the most fish, said Kofi Nyamegbe, in a low and steady voice as he stared into the ocean, where lots of fishing boats dotted the horizon.
“We say that all the time but it doesn’t mean anything anymore. There are many boats here, but the nets return empty most of the time,” said Nyamegbe.
Nyamegbe is among some 25,000 people who reside in the fishing village of Moree, on Ghana’s Cape Coast, about 120 kilometres from the capital Accra. He has been fishing for the past eight years, but the nets no longer return enough fish to sustain his family.
Ghana’s coastline is about 500km long, providing employment to at least 10 per cent of the population of about 27 million people.
“That translates into so many boats, all competing for the few fish,” said Farnyi Kweigya, Moree’s chief fisherman.
The exact amount of fish caught in Ghanaian waters is unknown, but the African Union Inter Bureau for Animal Resources (AU-IBAR) says Ghana is among the highest fish consuming countries on the continent, with a per capita consumption of 26 kilogrammes per person per year, against a global average of 10-19 kilogrammes.
The East African region has some of the lowest consumption rates, estimated at just 3 kilogrammes per person, per year.
“In Kenya, we eat 3.5 kilogrammes per person, which is ridiculously low,” said Prof Micheni Ntiba, the Principal Secretary in the State Department of Fisheries in the Ministry of Agriculture.
In the 1998/99 fishing season, Ghana had its highest fish harvest of 200,000 tonnes. Today, the catches barely hit 10 per cent of that figure.
“It means that our fish stocks are collapsing,” said Kofi Agbogah, a fisheries conservationist.
The United Nations Food and Agriculture Organisation (FAO) estimates the global marine fishing industry produces some 67 million tonnes of fish annually worth between $100 billion and $200 billion.
Africa’s coastal waters produce only 4.6 million tonnes of fish annually, valued at $4.9 billion. However, 52 per cent of the fish stock is fully exploited, 8 per cent is depleted, 19 per cent overexploited while 1 per cent is recovering from depletion, data from both the FAO and the AU-IBAR shows.
Key to the near collapse of the continent’s fisheries is the illegal, unregulated and unreported fishing, which costs the continent billions of dollars in lost revenue.
The World Bank’s Africa Programme for Fisheries reports that some 11-26 million tonnes of sea food is caught illegally every year, worth between $10 billion and $23.5 billion.
The West African coast is said to be the most affected by illegal fishing, with 40 per cent of total catches falling in that category.
In East Africa, Kenya’s coast has become quite vulnerable in recent years to illegal fishing, especially with regard to tuna fish. The government reports that the country loses at least $118 million annually due to illegal fishing and fish poaching.
“The worst thing is that we don’t have the capacity to sufficiently patrol our waters and protect our fish,” said Prof Ntiba.
Tuna is one of the most illegally caught fish in the world, estimated at seven million tonnes globally, with a value of $10 billion, data shows.
Kenya’s territorial waters lie within the South West Indian Ocean, the richest tuna belt, with the fishing season running from May to July.
“The demand for tuna is high, mostly in Europe and Asia,” said Prof Ntiba.
Although Africa often cries foul over illegal fishing, a number of conservationists believe that governments are abetting illegal activities, because when an unauthorised vessel is arrested off the African coast, it is quickly freed without any charges, as was the case recently in Nigeria.
Then there is Somalia, which has Africa’s longest coastline, extending some 3,300 kilometres where Illegal, unreported, and unregulated (IUU) fishing is exacerbated by the fact that there are no structures.
Somali factor
“It is difficult to say exactly how much fish is lost in Somalia due to the lack of structures to keep track of the numbers,” said Richard Trenchard, the FAO country representative for Somalia.
“The potential of the ocean to the Somali economy is $400 million annually. With a coastline that long, Somalia has a rich marine resource base, but they have serious challenges with overfishing.”
Illegal, unreported and unregulated fishing is carried out mostly by Chinese and European Union vessels, according to a report published in May last year by Greenpeace Africa, an organisation that advocates for environmental protection.
Kenya has licensed nearly 40 purse seiners in the past four years to fish in its waters. Of these, 14 are Spanish and 13 are French. In 2014 – the last year complete data is available – 35 foreign purse seiners took annual licences. Twenty five of these were from the European Union.
Kenya requires reporting – specifying the cargo on board, time and entry or exit position – as a condition of a licence for foreign vessels operating in its territorial waters.
The reporting is done at the State Department of Fisheries via the Director of Fisheries whenever entering and leaving Kenya’s exclusive economic zone (EEZ) – a sea zone prescribed by the UN Convention on the Law of the Sea.
Kenya also requires licensed foreign vessels to submit weekly catch data reports, but there are concerns that the reporting is not done accurately, purposefully concealing any illegal activities in its waters.
“I think where Kenya and a few other African countries go wrong is in reporting; fisheries officers are required to get on board those foreign vessels for a specific period of time to observe what they are doing,” said Edward Kimakwa, the fisheries programmes officer with WWF Kenya.
“Many countries fail to put their officers on board, which means then it becomes hard to verify if what is reported is true.”
Tanzania has licensed between 18 and 38 purse seiners to fish annually in their EEZ in the past six years. Of these 14 are Spanish and 13 French. In 2014, 33 foreign purse seiners took annual licences. Most licences are issued annually.
Payment of these licences is done per tonne of fish caught. In Kenya’s case, payment of royalties is stipulated in the Fisheries Act, but the method is not specified which is seen as loophole through which revenue leaks.
Between 2012 and 2014, though, purse seiners were charged $50,000 for a licence, a fee that has been reduced to $30,000. Kenya says the reduction is intended to make the country competitive in the light of the piracy threats in the Indian Ocean waters.
“This fee is low. But a Fisheries Management Bill before parliament proposes higher fees,” said Prof Ntiba.
Remedies
So what countries are doing to save their fish stock?
A number of African governments have made strides towards saving their fishing industries. Before 2,000, the Ghanaian fisheries department for example, was only interested in ensuring that the fishermen caught the most fish, hence the phrase “The best net is the one that catches the most fish.” But this brought more problems due to overfishing.
Last year, the Ministry of Food and Agriculture started registering the fishermen. But because most of them are small scale, it is difficult to track them down. Through the village chief fishermen, the government also conducts training on sustainable fishing practices.
There was also a plan to regulate the kind of nets the fishermen use so that the wrong species of fish are not caught, but the plan was shelved, because the fishing gear is linked to tribes and cultural practices, and therefore outlawing one gear would disadvantage an entire community.
In Southern Africa, the government is working with the fishermen because they know who the illegal fishers are.
“They are the eyes and ears in waters and it has worked excellently,” said FAO’s Mr Trenchard.
In Kenya, the government is constructing a monitoring control and surveillance Centre in Mombasa. This centre is expected to be operational by the end of the year. The country is also acquiring an off shore patrol vessel that will enable better tracking of illegal vessels in Kenyan waters.
“Kenya is also training its fisheries officers in offshore monitoring so that when the centre is up and running, the officers know exactly what to do,” said Mr Trenchard.
Last year, the Fisheries Management and Development Bill, which seeks stiff penalties for vessels caught fishing illegally in Kenya’s EEZ was formulated. The Bill is currently before parliament. Also, a Tuna Fisheries Development Management Strategy was launched in 2014, to enable Kenya exploit its stocks.
The only tuna fish processing plant in East and Southern Africa was in Mombasa and it shut down in June last year due to idle capacity.
Tanzania, on the other hand, has amended the Tanzania Deep Sea Fishing Authority Regulations in line with the Maputo Declaration, which not only enables it keep better track of its fish, but also better manage its stocks.
In the case of Somalia, it ratified the 2009 FAO International Port State Measures Agreement in November last year, which compels countries to eliminate, deter and prevent IUU, said Mr Trenchard.
Only 21 countries have ratified the agreement. Most African countries are yet to do so.
For Kenya, if the Fisheries Bill becomes law, it will enable the country to ratify and domesticate the provisions of the agreement.
Fish importing countries such as those in the European Union have laws that blacklist countries that fail to take action on illegal, unregulated and unreported fishing.
The EU is among the world’s biggest importers of fish and also among the biggest owners of distant water fishing vessels, with at least 15,000 registered to fish in such waters. It uses a card system – yellow and green – to decide whether a country should be blacklisted.
Ghana for instance, exports 128 million euros worth of fish to the EU every year, but in November 2013, it was yellow carded for failing to take sufficient action against IUU. Within two years, Ghana strengthened its legal framework and set punitive measures against IUU. In October last year, it received a green card and is back to exporting to the EU.
Prof Ntiba said African governments have the political will to strengthen the fishing industry.
“Look at the East African Community for instance. We have made great strides on the Lake Victoria region by working together. Each country is not only reviewing its fisheries laws but we are developing an EAC strategy that will see us work on fisheries as a block,” he said.
“Even at the AU level, ministers responsible for fisheries have held several meetings and are working on a continental strategy that will ensure that we collaborate in patrolling our waters, such that a vessel that breaks the law in one part of Africa does not run to and hide in another part of the continent,” he added.
According to WWF-Kenya’s Mr Kimakwa African countries need to learn from each other in order to strengthen the industry.
“Take Namibia for example which is using air surveillance systems. It is a small country yet it is winning the war on illegal fishing,” he said.
With fish being a big player in the global economy, the World Trade Organisation issued a ministerial statement on fisheries last year to scrap fishing subsidies, because they contribute to the over-exploitation of fish resources.
The ministerial was signed by 29 countries in the least developed regions of the world.
Related News


How ICT-driven concept can boost Africa’s trade ranking
African countries must join others around the world in adopting the National Single Window Environment, an ICT-based concept, to eliminate the bureaucracy posing a challenge to trade processing in the region, the managing director of West Blue Consulting, Valentina Mintah has said.
Speaking at a workshop on single window organised for Nigerian and Ghanaian journalists at the Royal Senchi Resort, Akosombo, Ghana, she declared excessive bureaucracy as the most severe constraint to trade processing in Africa.
Mintah said there was plenty of room for improvement for Africa countries if only they could adopt the single window concept in trade processing, noting that Swaziland ranks 1st in Africa and 30th in the world out of 189 countries on the World Bank trading across border index, with Zimbabwe ranking 100, Ghana 171 and Nigeria 182.
If African countries and stakeholders, according to her, could join forces and pursue the goals of the national single window, a concept developed by the United Nations Economic Commission for Europe (UNECE) in 2005, to simplify, harmonise and standardise international trade procedures and associated information flows between trade and government and within government itself, it would be relatively easy to create a solid foundation which will enable the continent achieve the 50 percent better, faster and cheaper trade across border indicators.
The single window, according to the UN Centre for Trade Facilitation and Electronic Business (UN/CEFACT), is “a facility that allows parties involved in trade and transport to lodge standardized information and documents with a single entry point to fulfil all import, export and transit related regulatory requirements.”
Mintah, who is the lead consultant in the implementation of the Nigeria’s single window concept, said “so matter how much is done as individual institutions and countries in addressing these bottlenecks, it cannot be compared with the positive and timely impact that can be achieved with the joined up efforts of all stakeholders.”
Speaking further, the expert who now presently leads the implementation of the Ghana single window concept, added “that African importers and exporters remain uncompetitive in the global business arena is largely attributable in part, to the number of days it takes to complete import and export processing and their attendant costs.
“The collaboration of sister countries, Ghana and Nigeria on trade facilitation activities will bring about further gains in our quest for increased inter African trade, with the realisation of efficient processes and movement of goods.”
The single window concept she said, helped countries to transition from a culture of delays and high costs of doing business to a culture of faster, simpler, automated and predictable means of processing imports, exports and transit trade.
According to her, many countries around the world are currently focusing on implementing major trade facilitation reforms to enhance their competitiveness and increase their participation in global economy, pointing out that Africa should not be left out.
Since its inception in 2005, single window has been implemented in over 70 countries and the concept is now seen by the World Bank and many other development agencies as a key tool to enhance the trade and economic competitiveness of a country.
Mintah equally defined a single window as “an organic concept focusing on the way we do business both within government and between government and business, ensuring the maximum integration, harmonization and standardization of the process, procedures and related information flows within the international trade environment. She said it was essentially driven by the principle of a partnership between trade and government for economic development and prosperity of a country.
She described the single window as not just an IT software to be procured but a concept that must be organically implemented according to individual country’s needs, adding that in implementing the single window, countries should not stand still at any point, but should see continuous innovation as key to the success of the concept.
“You can’t stand still in this environment, everybody is innovating and competition is high… so many elements come into play in this environment,” Mintah stated, adding what Nigeria had done were only some of the ingredients needed for the full meal to be cooked.
Related News

Liner shipping: Is there a way for more competition?
With around 80 per cent of global trade by volume and over 70 per cent of global trade by value carried by sea, and with these shares being even higher in the case of most developing countries, maritime transport, including liner shipping, remains highly important for international trade and the global economy.
To ensure stability in the sector, in various jurisdictions around the world, liner shipping conferences – arrangements among ocean carriers allowing for freight rate fixing – have been exempted from the application of competition laws over the years. Many of these jurisdictions confer exemptions, under similar conditions also to consortia and strategic alliances – arrangements among ocean carriers that do not involve freight rate fixing.
This paper aims to provide an overview of recent and potential developments related to competition and cooperation in liner shipping.
A number of reviews and studies conducted over the last decades by organizations and individual countries have suggested that liner shipping may not be unique, as its cost structure does not differ substantially from that of other industries, or at least not sufficiently to justify that it needs to be protected from competition, by being exempted from competition laws.
As a result, such exceptions have gradually come under review and have narrowed in scope, giving more space to pro-competition, non-ratemaking agreements.
Therefore countries are encouraged to establish appropriate and harmonized regulatory systems to support and monitor such agreements.
Carriers may continue to collaborate to achieve operational improvements, while the competition authorities ensure that the competition in the market is sufficient and shippers benefit from eventual cost savings. At the same time, enhancing cooperation between national competition agencies, sharing of information among them, and other relevant measures shall be encouraged.
Introduction
Although the content and practice of competition laws, including those applicable to liner shipping, vary in different countries, their purpose is “to control or eliminate restrictive agreements or arrangements among enterprises, or mergers and acquisitions or abuse of dominant positions of market power, which limit access to markets or otherwise unduly restrain competition, adversely affecting domestic or international trade or economic development”.
Throughout its history, liner shipping, the business of offering regular time scheduled ocean shipping services in international trade, has enjoyed exemptions from the effect of certain competition rules and, as a result, conferences among oceans carriers, allowing for freight rate fixing, have been permitted. The main reason for this practice has been the belief that it was justified by the specific economic problems faced by liner shipping as compared to other industries. These include unusually high fixed costs, very large initial capital investment, other large non-cargo costs, overcapacity, etc. As a result, it was argued that without collective freight rate fixing, open and unrestrained competition would lead to “destructive” competition, instability of prices and undesirable oligopoly.
Following discussion in many countries and regional organizations as to whether exemptions from competition rules, historically enjoyed by liner conferences, are still justified, there has been a tendency during the last decade towards review and narrowing of the scope of such exemptions. In addition, there appears to have been a shift of emphasis among shipping lines away from the traditional liner conferences, and towards the establishment of alliances and other forms of efficiency-enhancing operational types of agreements. In these circumstances, carriers continue to collaborate to achieve operational improvements, while the competition authorities ensure that there remains sufficient competition in the market so that eventual cost savings are passed on to the shippers.
This paper will briefly examine the rationale behind the exemptions from the effects of competition laws that have been historically granted to liner shipping cooperative arrangements, the legitimacy and continued justification for such exemptions, as well as applicable instruments, negotiations, and relevant legislative developments. It will continue with a brief description of the recent global alliances among major shipping lines, related considerations, potential legal uncertainties and the way forward.
Related News


Business leaders, UN Member States and civil society agree: Gender equality critical to economic development
The UN Global Compact and UN Women organize the Women’s Empowerment Principles Annual Event
Recognizing gender equality as a fundamental human right, central to driving the global economy and achieving the recently adopted Sustainable Development Goals (SDGs), business leaders joined UN Member States and civil society organizations at the Women’s Empowerment Principles (WEPs) Annual Event. The event focused on the multiplier effect of empowering women and girls in advancing all development issues and the enormous opportunity for business to lead on promoting gender equality.
In the keynote address, His Excellency Mr. Luis Guillermo Solís Rivera, President of Costa Rica urged: “The time is right. International consensus has been reached, at Beijing+20 and in Agenda 2030, about the importance of women’s empowerment in the global sustainability agenda.” He emphasized that “a society that puts gender equality at its forefront not only grows economically but becomes more human.”
UN Secretary-General Ban Ki-moon explained, “We cannot achieve our Sustainable Development Goals without securing the full and equal rights of half of the world’s population, in law and in practice.” He noted that “when companies invest in women, they see a range of benefits and a return on investment. It is clear that gender equality is a business issue.”
The Women’s Empowerment Principles – a partnership initiative of the UN Global Compact and UN Women – provide companies with an integrated and proven approach to unlocking the power of women in business and society. It is the largest business-led gender equality initiative in the world endorsed by more than 1,100 CEOs from 80 countries. Held in conjunction with the 60th Commission on the Status of Women, this year’s annual event spotlighted companies that are implementing the WEPs to achieve the SDGs, step up action, and find innovative ways to partner and advance gender equality.
Phumzile Mlambo-Ngcuka, Executive Director of UN Women, stressed the importance of partnerships and collaboration with business to achieve gender equality, stating: “The engagement and commitment of the private sector to gender equality are essential to reaching the Agenda 2030 goals and aspirations. Gender equality and sustainability must be integral to every business plan and strategy.”
Lise Kingo, Executive Director of the UN Global Compact told participants, “We have not reached the tipping point on gender equality. It’s time that we have honest conversations about what is really holding women back. We need to end bias, both overt and unconscious. We must recognize that gender equality is not just a women’s issue – it’s a men’s issue, a family issue, a community issue and a business issue.”
To help accelerate progress, the development of a new gap analysis tool was announced by the Inter-American Development Bank, the UN Global Compact and UN Women, along with supporting partners from business and government. The tool will assist companies in identifying gaps in gender equality and scale up implementation of the Women’s Empowerment Principles.
Five CEOs Recognized for Leadership on Gender Equality
Since 2013, the Annual Event has included the presentation of the Women’s Empowerment Principles CEO Leadership Awards, acknowledging business leaders for championing gender equality and implementing the principles, in particular Principle One which urges CEOs to lead by example.
Conferring the awards, Joseph Keefe, Co-chair of the WEPs Leadership Group and President and Chief Executive Officer of Pax World Funds said: “The WEPs are an effective tool to advance women in business and society. The WEPs CEO Leaderships Awards bring to life concrete actions and measurable impacts that are changing workplaces, marketplaces and communities. As a previous Awards recipient, I know that this prestigious award gives companies encouragement to press forward with this important work.”
The 2016 WEPs CEO Leadership Award recipients are:
-
Jean-Paul Agon, Group Chairman and Chief Executive Officer, L’Oréal (France) – Benchmarking for Change WEPs CEO Leadership Award
-
Federico Bernaldo de Quiros, Chief Executive Officer, Toks Restaurantes (Mexico) – Community Engagement WEPs CEO Leadership Award
-
Lance Hockridge, Chief Executive Officer, Aurizon (Australia) – Cultural Change for Empowerment WEPs CEO Leadership Award
-
Michael Landel, Chief Executive Officer, Sodexo (France) and Janet Awad, Regional Chair of Latin America and Country President, Sodexo Chile (Chile) – 7 Principles WEPs CEO Leadership Award
-
David Sproul, Senior Partner and Chief Executive, Deloitte UK (United Kingdom) – Business Case for Action WEPs CEO Leadership Award
About the Women’s Empowerment Principles
Launched in 2010 the Women’s Empowerment Principles – Equality Means Business has grown to become the largest business-led gender equality initiative in the world endorsed by more than 1,100 CEOs from 80 countries. The Principles highlight that empowering women to participate fully in economic life across all sectors and throughout all levels of economic activity is essential to build strong economies; establish more stable and just societies; achieve internationally agreed goals for development, sustainability, and human rights; improve quality of life for women, men, families and communities; and propel business’ operations and goals.
Related News

Transport sector joins fight against wildlife crime
The global fight against wildlife crime received another major boost with the signing of a declaration at Buckingham Palace in London committing the leaders of the global transportation industry to take concrete steps to tackle wildlife trafficking.
Leaders of 40 airlines, shipping firms, port operators, customs agencies, intergovernmental organisations and conservation charities from around the world signed the historic Declaration of the United for Wildlife International Taskforce on the Transportation of Illegal Wildlife Products at the palace.
“The poaching crisis is bringing violence, death, and corruption to many vulnerable communities and threatens to rob future generations of their livelihoods,” said the Duke of Cambridge. “But this crisis can be stopped. By implementing these commitments, the signatories of the Buckingham Palace Declaration can secure a game changer in the race against extinction. I thank them for their commitment and I invite any other company in the industry to sign up to Declaration and play their part in the fight against the poaching crisis.”
The Buckingham Palace Declaration is the result of a year’s worth of meetings, research, and coalition building by the United for Wildlife Transport Taskforce, convened by The Duke of Cambridge and chaired by Lord Hague of Richmond.
Transport representatives on the Taskforce include companies and organisations based in China, USA, UAE, Kenya, the UK and Denmark.
“The Buckingham Palace Declaration is a major achievement as the transport sector has a key role in tackling this destructive trade. This landmark agreement sets out clear actions the transport industry can take to stop criminals from exploiting their legal transit routes,” said Glyn Davies, Conservation Director, WWF-UK.
“We applaud the 40 companies that have already signed this landmark agreement and encourage other companies to sign up too. Together we can stop this devastating trade.”
The Declaration commits signatories to eleven steps that will raise standards across the transportation industry to prevent traffickers from exploiting weaknesses as they seek to covertly move their products from killing field to marketplace.
The commitments focus on information sharing, staff training, technological improvements, and resource sharing across companies and organisations worldwide. They will also see the world's leading transportation firms assisting those in poorer nations who are in need of expertise and new systems.
“WWF is proud to be part of this dynamic United for Wildlife Taskforce and looks forward to continuing to work with the signatories in tackling this devastating trade in the parts of threatened animals,” added Davies. “Now we have the Declaration, efforts must focus on implementing the much needed actions to help end this illegal trade. Only by making it harder for criminals can we stop the trade.”
The work of the United for Wildlife Transport Taskforce has been strongly supported not only by the transport sector but a number of intergovernmental agencies including the World Customs Organisation, the United Nations Development Programme and importantly CITES – the world's regulatory instrument on trade in endangered species.
“I want to thank everyone who has been part of this unprecedented initiative and I ask them all to sustain the momentum we have established over the past 15 months,” said Lord Hague. “It is nearly too late to save our rhinos, elephants, tigers, and other iconic species, but it is not quite too late. It will require our combined efforts, resolve, and intensified determination and that is what this Declaration is about.”
The commitments in the Buckingham Palace Declaration include:
-
Developing information sharing systems for the transport industry to receive credible information about high risk routes and methods of transportation;
-
Supporting a secure system for passing information about suspected illegal wildlife trade from the transport sector to relevant customs and law enforcement authorities; and
-
Notifying relevant law enforcement authorities of cargoes suspected of containing illegal wildlife and their products and, where able, refuse to accept or ship such cargoes.
Related News


tralac’s Daily News Selection
The selection: Wednesday, 16 March 2016
African Transformation Forum: closing address by President Kagame
Africa Pension Funds Network: update (AfDB)
Discussions about the WAEMU are often limited to questions about the degree of overvaluation of the real effective exchange rate and the level of remuneration of the central bank’s foreign exchange reserves. These are valid questions, especially as they relate to competitiveness and the opportunity cost of leaving foreign exchange reserves at the French Treasury. But they are not the only ones. In this note, we explore a number of other questions to provide a greater insight on the nature of regional economic communities in Africa. [The authors: Amadou Sy, Mariama Sow]
EALA passes key report on governance and project performance issues in EAC institutions
The objectives of the assessment were to assess whether governance and management systems of the institutions are good enough to guarantee performance and proper discharge of duties. It further sought to establish the implementation of the Assembly’s recommendations, strengthen governance and management systems of EAC Institutions and to establish extent to which the said institutions apply modern governance and management of applied technologies.
SADC Council of Ministers: briefing (SADC)
On the Tripartite Free Trade Area, Council urged member states to expedite conclusion of outstanding Phase 1 negotiation issues, which include rules of origin, trade remedies, and finalization of tariff negotiations in order to fully operationalize the Tripartite Free Trade area and endorsed the proposal by the Tripartite Task Force to convene a Tripartite Council of Ministers, preceded by the Sectoral Ministerial Committee meeting on 9-14 May 2016 to facilitate unlocking of all outstanding Phase 1 issues; and directed the Secretariat as current chair and coordinator of the Tripartite Task Force to facilitate the legal scrubbing of all completed Annexes before the proposed Sectoral Ministerial Committee; and mobilization of resources for Phase 2 TFTA issues.
Enhancing India’s engagement with the Southern African Development Community (Export-Import Bank of India)
During the last ten years, India’s total trade with the SADC countries has witnessed over eight-fold increase from $3.7bn in 2004 to $29.6bn in 2014. While India’s total exports to SADC has risen from $1.6bn in 2004 to $15bn in 2014, depicting a nine-fold rise during the period, India’s total imports from SADC have also risen, although at a slower pace, from $2bn to $14.6bn, showing a seven-fold rise. India’s trade balance with SADC turned into a surplus of $0.4bn in 2014, after witnessing a deficit for six consecutive years.
The increasing importance of India as SADC’s trading partner can be assesses from the fact that India accounts for a respectable 7.4% of SADC’s global imports in 2014, which was significant improvement compared to 2.1% recorded in 2004. Further, India accounts for around 7% of SADC’s total exports, up from 3.3% in 2004, depicting the rising importance of India in SADC’s trade configuration. The importance of the SADC region can also be gauged from the fact that the region accounted for 4.7% of India’s global exports in 2014, up from 2.2% recorded in 2004. India’s imports from SADC region, as a percentage share of India’s global imports, accounted for 3.2% in 2014. The period also witnesses a rise in the importance of SADC in India’s global trade configuration. [Download]
India-Africa trade relations: the way ahead (Economic Times)
While the two-way trade and investment ties have deepened, the future potential is much higher. With the changing architecture of global trade agreements, the focus is shifting towards creating value-chain and investment-led trade. The Indian private sector can leverage available institutional mechanisms to further deepen its trade and economic footprint in African nations. The second important instrument is the EXIM Bank/Government of India's Lines of Credit (LoC). Undoubtedly, LOCs have helped Indian companies enter the African market as well as expand their footprint in the continent. This is evident from the fact that LOCs to African countries constitute 60 per cent of all LOCs. However, there is still a gap between LOC commitments and actual disbursement, which needs to be bridged. [The author, Chandrajit Banerjee, is the Director General of the Confederation of Indian Industry]
India’s exports contract for 15th month on tepid demand (Livemint)
The trade deficit narrowed further from its previous month’s low, data released by the commerce ministry showed. Exports shrank 5.66% in February and imports contracted 5.03%, leaving a trade deficit of $6.5 billion. Only eight out of the 30 import items reported growth in February, compared with 10 in January. Among the major items, the import of coal (-16.85%), petroleum (-21.9%), chemicals (-1.05%), iron and steel (-12.46%), transport equipment (-7.9%) and gold (-29.5%) contracted, while the import of precious stones (41.2%) and machinery (50.2%) shot up. Shipments of 14 out of the 30 top export items grew in February, against 13 in the previous month. Among the major items, export of gems and jewellery (11.2%), pharmaceuticals (8.8%) and chemicals (4.5%) increased, while export of engineering goods (-11.2%), readymade garments (-0.72%) and petroleum products (-28.3%) fell.
UNCTAD Investment Policy Monitor: latest edition
The Monitor finds that 25 countries took 41 investment policy measures between October 2015 and February 2016. The share of liberalization and promotion measures was 85% - broadly in line with last year's average. These policy measures show a continued move towards improving entry conditions, reducing restrictions and facilitating foreign investment. In terms of policy types, measures related to "entry/establishment" were predominant. UNCTAD found that countries concluded ten new international investment agreements, bringing the total number of IIAs to over 3280 at the end of February 2016. The new treaties are five bilateral investment treaties and five "other IIAs", including the Trans-Pacific Partnership. At least six IIAs entered into force.
Chinese presence in real estate in South Africa and Mauritius (CCS)
Preliminary statistics from research centres, and media and public discourses highlight South Africa and Mauritius as two of the most popular destinations of Chinese real estate investment. This paper investigates the substantiality of these hypotheses and assesses the impact Chinese real estate activities have on the socio-economic environment of the respective two countries. It also provides policy propositions that would ease these prospective challenges to the two societies. [Africa-China relations: Lagos conference (Yale)]
Botswana: new trade portal makes import, export easier, cheaper (World Bank)
The Botswana Trade Portal is a web-based database system, which makes all cross-border trade regulatory information available at a stroke of a key. The information includes all laws, prohibitions, restrictions, technical standards, the entire commodity classification and tariffs, all procedures for license and permit application and clearance, copies of all forms as well as plain language instructions. The trade portal also enables traders to see, in response to a single query, all the obligations they need to comply with to import or export a specific good.
Namibia: the Annual Trade Statistics Bulletin 2015 is available for download
South Africa: Reserve Bank Quarterly Economic Review is posted
South Africa: MPs question viability of Congo hydro project (Business Day)
MPs on Tuesday questioned the country’s substantial investment in the Grand Inga hydroelectric scheme, citing political instability in the Democratic Republic of Congo. SA is poised to pump more than R64bn into the ambitious scheme to transmit about 2,500MW from the DRC to a power station in Limpopo.
Closer look at South African pork market shows opportunities (National Hog Farmer)
According to USDA estimates, South Africa is the world’s 20th largest pork producer at 245,000 mt per year. South Africa imported about 38,500 mt of pork in 2015, valued at $81.8 million, with Germany, Canada and Spain being the primary suppliers. This was an increase of 55% in volume and 36% in value from 2014, though still down slightly from the peak volume level of 2011 (41,371 mt) and the peak value level of 2012 ($98 million). With US pork re-entering the South African market after a significant absence, displacing existing suppliers will present a challenge — especially considering the access limitations that remain in effect. However, US pork has achieved success in markets with similar import restrictions — Australia, for example, is currently the seventh-largest destination for US pork.
Zambia: value chain, jobs diagnostics project launched (World Bank)
The Let’s Work Partnership recently met with government officials, donors, the private sector, and other key stakeholders in Zambia to share the preliminary findings of the Zambia Jobs Diagnostic and to launch the Let’s Work’s Zambia Value Chain Analysis in the agriculture and construction sectors. Both products will be used to support the design of a forthcoming World Bank project aimed at creating economic diversification for more, better, and inclusive jobs in Zambia. The project will include a focus on agribusiness/agro-processing opportunities. The Zambia Jobs Diagnostic is being conducted in collaboration with the Zambia Institute for Policy Analysis and Research (ZIPAR), and will be finalized in the coming months.
Mombasa hosts conference on transport and road research (Coast Week)
More than 300 senior researchers and policy markers including stakeholders are due to meet in Kenya’s coastal city of Mombasa from Tuesday to seek ways of improving research on transport, organizers said on Sunday. A statement from the Kenya Roads Board said the three-day International Conference on Transport and Road Research will bring participants from Africa and South East Asian regions. [Conference programme]
Related: Mozambique’s Great Gas Road (Natural Gas Daily), Angola: strategic road and rail links create a new long-haul logistics platform for the region (World Folio), Namibia: Dry port held up (Informante), Sinotruk to improve logistics, services in Africa (China Daily)
The cost of an emerging national oil company (Chatham House)
This research paper is a product of the New Petroleum Producers Discussion Group, a project which aims to enhance the capacity of emerging oil and gas producers to establish context appropriate rules and institutions for good governance of their petroleum sectors and to engage credibly with international partners. The project engages with a wide range of countries in the Eastern Mediterranean, North Africa, sub-Saharan Africa, Southeast Asia and the Caribbean, where exploration interest surged during the high oil price era. This prompted domestic debates about how to structure and govern the nascent petroleum sector with the aim of maximizing long-term benefits to the nation. [The author: Valérie Marcel] [Patrick Heller: blog on recent New Petroleum Producers Discussion Group meeting in Kenya (NRGI)]
Pradeep S. Mehta, Smriti Bahety: 'India’s solar panel dispute: a need to look within' (The Wire)
Do environmental policies affect global value chains? (OECD)
Mauritius ready to help Pakistan access African markets (The Nation)
High-level panel on women's economic empowerment holds first meeting (UN)
Here is a reminder that international trade makes America great (US Chamber of Commerce)
tralac’s Daily News archive
Catch up on tralac’s daily news selections by following this link ».
SUBSCRIBE
To receive the link to tralac’s Daily News Selection via email, click here to subscribe.
This post has been sourced on behalf of tralac and disseminated to enhance trade policy knowledge and debate. It is distributed to over 350 recipients across Africa and internationally, serving in the AU, RECS, national government trade departments and research and development agencies. Your feedback is most welcome. Any suggestions that our recipients might have of items for inclusion are most welcome.
Related News


India lays emphasis on capacity building in all engagements with Africa: V K Singh
Mutual cooperation fundamental to India-Africa partnership
India has a key role in Africa’s development process and lays particular emphasis on capacity building in different African countries. Stating this in his special address in the inaugural session of the two-day 11th CII-EXIM Bank Conclave on India Africa Project Partnership, being organised in New Delhi, Gen. (Retd) V K Singh, Minister of State for External Affairs, Government of India, said that India’s economic resurgence will have continued positive bearing on Africa’s development initiatives.
The Minister said the Conclave provides India and Africa the opportunity to plan effective utilisation of the major offers made by India at the 3rd India Africa Forum Summit that was held in New Delhi in October 2015. He stated that mutual cooperation is fundamental to India-Africa partnerships. He underlined the need for deeper bilateral cooperation and partnerships for sustainable development, covering areas like clean technology, solar energy, and climate-resilient agriculture.
According to the Minister, while India-Africa bilateral trade has increased from $30 billion in 2008 to $72 billion in 2015, there is immense scope for increasing the bilateral trade flows. He urged the least developed countries (LDCs) in Africa to take full benefits from the Duty Free Tariff Preferential (DFTP) Scheme extended to LDCs by Government of India, and thereby increase African LCDs share of total African exports to India. Mr Singh called upon CII and EXIM Bank to take renewed effort to facilitate simplification of procedures governing India-Africa business and investment engagements.
Mr James Wani Igga, Vice President, Republic of South Sudan, invited Indian companies and investors to participate in South Sudan’s economic and industrial diversification. Currently, South Sudan has high dependence on oil production and exports.
Mr Igga said that the South Sudan government extends a package of incentives to prospective investors that includes tax holidays, access to land, entry work permits, easy licensing, etc. He also underscored the need for greater joint efforts by India and Africa to meet the UN’s Sustainability Development Goals.
Mr Kwesi Amissah Arthur, Vice President, Republic of Ghana, said in his special address that it is imperative for African economies to be insulated from the vagaries of global trade cycles. This could be achieved by reducing Africa’s dependence on exports of primary goods. Mr Arthur said that Indian companies and investors could play a key role in helping African industries to move up the value chain. He laid emphasis on deeper bilateral MSME cooperation, while adding that a robust MSME sector ensures more employment opportunities to the youth.
Mr Okechukwu Enelamah, Minister of Industry, Trade and Investment, Republic of Nigeria, said in his special address that the deliberations at the Conclave should be directed toward critical evaluation of the earlier commitments made by India toward Africa so that there is greater clarity on what elements of cooperation and assistance need to be carried forward. Mr Enelamah said that the private sector can give concrete expression to the vision of Indian and African leadership for long-term bilateral cooperation and partnerships. He added that the civil society could also play a key role in this regard.
Referring to the ‘Make in India’ campaign, he said that Nigeria would look to learn from India’s experience in driving local manufacturing growth. He also called for a more liberal visa regime that would facilitate easier people-to-people contacts between India and Nigeria.
Mr Sumit Mazumder, President, Confederation of Indian Industry, said that Indian FDI in Africa which stands at $13.6 billion accounts for 16% of India’s overall outward FDI. Africa is the second biggest FDI destination for India, he said. Mr Mazumder underlined the growing complementarity between Indian and African economies in terms of manufacturing exports and resource trade.
Mr Yaduvendra, Mathur, Chairman & Managing Director, EXIM Bank of India, said that large physical infrastructure development projects in Africa present compelling investment opportunities to Indian companies. He also called for focused attention on funding of innovations and innovative projects led by young entrepreneurs.
Mr Noel N Tata, Chairman, CII Africa Committee and Managing Director, Tata International Ltd, said that as African economies aims to accelerate their manufacturing growth, India will be an attractive destination market for their products.
Earlier, Mr Chandrajit Banerjee, Director General, Confederation of Indian Industry, said in his opening remarks that geographical and product diversification are key to India’s expanded trade ties with Africa.
This Conclave has engaged the participation of 23 ministers from Africa, over 400 delegates from 37 African countries and over 400 delegates from India. At the session, the EXIM Bank report on “Focus Africa: Enhancing India’s Engagement with Southern African Development Community” and a background report on India-Africa Project Partnership were released.
Focus Africa: Enhancing India’s Engagement with Southern African Development Community
Executive Summary
SADC, currently comprising 15 member states namely Angola, Botswana, the Democratic Republic of the Congo (DR Congo), Lesotho, Madagascar, Malawi, Mauritius, Mozambique, Namibia, Seychelles, South Africa, Swaziland, Tanzania, Zambia and Zimbabwe, is an integral part of the African region comprising 32.5 per cent of total land area of Africa, 27.7 per cent of total population of Africa. SADC is the second-largest contributor (in terms of GDP) to the African region, after ECOWAS. It accounts for 37 per cent of nominal GDP of Sub-Saharan Africa; 27.9 per cent of GDP of Africa and 0.8 per cent of global GDP in 2014.
The average economic growth of SADC was at 4.6 per cent in 2014, lower than 5.4 per cent recorded in the previous year, mainly due to sluggish growth in two of its major economies, South Africa and Angola. While South Africa’s growth was subdued due to frequent mining strikes and weakness of the rand during the year, fall in oil sector output affected that of Angola. DR Congo, Mozambique and Tanzania were among the fastest growing economies in the region in 2014.
Since mid-2014, major changes in the global economic environment have affected the region’s growth. Oil prices have declined since June 2014, and supply and demand factors have both contributed to these developments.
SADC’s combined GDP stood at US$ 686.8 billion in 2014, as compared to US$ 687.7 billion in 2013. SADC is largely dominated by oil exporting economies. South Africa is the largest economy in the region, accounting for 51 per cent of the region’s economy, followed by Angola (18.8 per cent), and Tanzania (7 per cent).
Average per capita GDP, at current prices, of the region, was at US$ 2,222.1 in 2014, a fall compared to US$ 2,278.8 in 2013. Average consumer price inflation of the region on the other hand has moderated during the same period (Table).
The economies within the SADC region are at varying stages of development, and also differ significantly in terms of their sizes. For instance, the GDP of SouthAfrica, which stood at US$ 350.1 billion in 2014, was much larger than the combined GDP of the remaining fourteen SADC countries, viz. US$ 336.7 billion. Positive growth rates of real GDP were recorded in all the member countries in 2014, accompanied by moderate inflation in most of the countries.
International Trade of SADC Countries
Reflecting the increasing globalization of theSADC economies, SADC’s global trade has witnessed significant upward trend in recent years. During the period 2004 to 2014, SADC’s total trade has risen nearly three-fold, from US$ 137 billion in 2004 to US$ 410.7 billion in 2014, growing at a compound annual growth rate of 11 per cent over the period.
SADC as a bloc has shown stable performance in terms of its global trade. SADC’s share in global trade has increased from 0.7 per cent in 2004 to 1.1 per cent in 2014. However, the share of SADC in Africa’s total trade has decreased from 41 per cent in 2004 to 34.8 per cent in 2014.
In the case of exports, SADC’s total exports have risen from US$ 61 billion in 2004 to US$ 208.3 billion in 2014, with a resultant rise in the share of SADC in global exports from 0.6 per cent to 1.1 per cent during the period. SADC’s exports have been driven by exports of South Africa and Angola, the two giants in the bloc accounting for 74 per cent of the region’s exports.
As regards imports, SADC’s total imports rose to US$ 202.4 billion (1.1 per cent of global imports) in 2014, up from US$ 76 billion (0.8 per cent) in 2004.
During the decade, trade balance of SADC reversed from a deficit of US$ 15 billion in 2004 to a surplus of US$ 5.9 billion in 2014. The shift to surplus was mainly driven by Angola (maintaining a trade surplus of US$ 37.2 billion in 2014), primarily due to large revenues from oil exports. Other economies in the region that maintained a surplus during the year include DR Congo, Swaziland, Zambia and Botswana. In the SADC region, economies that maintained a trade deficit in 2014 include South Africa, Tanzania, Mozambique, Zimbabwe and Mauritius.
Among the countries in SADC, the largest exporters are South Africa and Angola, together accounting for 74 per cent of SADC’s total exports in 2014. Other important exporters from SADC include Zambia, Botswana, DR Congo, Namibia and Tanzania. The major items exported by the region include mineral fuels (crude petroleum), the largest export item accounting for as much as 36 per cent of SADC’s total exports in 2014, followed by pearls and precious stones, ores and slag, copper and its articles, vehicles, iron and steel and machinery. In 2014, major markets for exports from SADC include China, USA, India, South Africa, and Switzerland.
As regards imports, the leading importers in SADC are South Africa and Angola, together accounting for 62.5 per cent of SADC’s total imports in 2014. Mineral fuels and machinery are the two largest import items, followed by electronic & electrical equipment, vehicles, plastics and articles, articles of iron or steel and pharmaceutical products. As regards SADC’s global imports, China has emerged as the leading supplier to SADC, accounting for as much as 14.4 per cent of SADC’s total imports in 2014, followed by South Africa and Germany. India is the fourth-largest source of SADC’s imports, accounting for 5.3 per cent in 2014.
India’s Bilateral Trade Relations with SADC Countries
SADC has emerged as important partner for India, both as an export destination as also an import source. The economic and trade linkages, which saw an expansion of trade volumes, stand testimony to the intensified economic engagement.
During the last ten years, India’s total trade with the SADC countries has witnessed over eight-fold increase from US$ 3.7 billion in 2004 to US$ 29.6 billion in 2014.
While India’s total exports to SADC has risen from US$ 1.6 billion in 2004 to US$ 15 billion in 2014, depicting a nine-fold rise during the period, India’s total imports from SADC have also risen, although at a slower pace, from US$ 2 billion to US$ 14.6 billion, showing a seven-fold rise. India’s trade balance with SADC turned into a surplus of US$ 0.4 billion in 2014, after witnessing a deficit for six consecutive years.
The increasing importance of India as SADC’s trading partner can be assesses from the fact that India accounts for a respectable 7.4 per cent of SADC’s global imports in 2014, which was significant improvement compared to 2.1 per cent recorded in 2004. Further, India accounts for around 7 per cent of SADC’s total exports, up from 3.3 per cent in 2004, depicting the rising importance of India in SADC’s trade configuration.
The importance of the SADC region can also be gauged from the fact that the region accounted for 4.7 per cent of India’s global exports in 2014, up from 2.2 per cent recorded in 2004. India’s imports from SADC region, as a percentage share of India’s global imports, accounted for 3.2 per cent in 2014. The period also witnesses a rise in the importance of SADC in India’s global trade configuration.
Foreign Investment in SADC Countries
FDIs flows to the SADC region have been mainly been resource-based. According to the United Nations Conference on Trade and Development’s (UNCTAD) World Investment Report 2015, FDI inflows to the SADC region stood at US$ 16 billion in 2014, as compared to US$ 5.6 billion in 2004. FDI flows to a region account for a nearly 30 per cent of Africa’s total FDI inflows in 2014.
South Africa and Mozambique continued to be major destinations for FDI inflows to SADC. Other destinations for FDI flows during the same year were Zambia, Tanzania and DR Congo.
Outward FDI flows from SADC declined to US$ 9.2 billion in 2014, as compared to US$ 13.2 billion recorded the preceding year. Outward FDI from SADC were primarily dominated by investments from South Africa and Angola.
India’s Investment Relations with SADC Countries
In the SADC region, Indian multi-national enterprises (MNEs) have ventured into both Greenfield and Brownfield investments, spanning across various sectors including manufacturing, mining, construction, and energy, among others. According to data from the Ministry of Finance and Reserve Bank of India, India’s approved cumulative investments in the SADC region during April 1996 to March 2015 amounted to US$ 46.5 billion. Mauritius, Mozambique and South Africa were the top destinations of India’s investments in the region. India’s investments in the SADC region accounted for nearly 93 per cent of Indian investments in Africa.
Indian FDI in Africa has traditionally been concentrated in Mauritius, taking advantage of the latter country’s offshore financial facilities and favourable tax conditions. Indian investors have, however, been investing in other countries in the region, too.
Indian banks are growing their partnerships with SADC countries largely based on their clients, who have increased demand for banking options in the region. Select Indian Banks in SADC region include Bank of India, Bank of Baroda, State Bank of India, Canara Bank, and ICICI Bank Ltd. Joint ventures by Indian Banks in the SADC region include Indo-Zambia Bank Ltd. (Bank of Baroda, Bank of India and Central Bank of India).
FDI inflows to India from SADC region have been dominated by investments from Mauritius that accounts for 35.2 per cent of India’s overall FDI inflow. During April 2000 to March 2015, FDI flows from the region into India stood at US$ 88 billion. Mauritius is the largest investor in India in terms of cumulative FDI inflows, mainly due to the Double Taxation Avoidance Convention. Others countries from the region investing in India include South Africa, and Seychelles.
Investment Opportunities for India in SADC Countries
SADC economies are one of the most resource-rich countries in the world. Areas of critical importance for SADC region include development of select sectors including infrastructure, agriculture and agro-processing, mining, manufacturing and ICT sectors, among others. The primary reason for low levels of development in the region stems from limited economic capacity to invest. Given these, select sectors which hold potential for Indian investments in the region have been identified in the study.
Strategies and Recommendations for Enhancing Bilateral Commercial Relations with SADC countries
Broad strategies for enhancing bilateral commercial relations with SADC countries include the following.
• Development of a strong Private Sector
An important challenge faced byAfrican countries, especially SADC member states is a lack of clear delineation of the roles of state and market. After the independence, most of the African countries tried to solve their immediate problems of poverty and food security by creating a strong state. Although, this has helped these countries to improve their human development factors, economically resulted in poor performance and development. This has resulted in many of the SADC countries remain in a backward state compared to many other developing countries. Hence, development of a strong private sector in the region is important. For the development of private sector, many elements including a well functioning financial system coupled with stable macroeconomic fundamentals are necessary. India being an economy with almost a similar background is better suitable to help these nations in this respect than many developed countries. Indian investors can play a major role by way of transfer of technical knowhow and technology which is suitable for the conditions and needs of a developing nation. This could help SADC countries to enhance its competitiveness by building its human and physical capital.
• Cooperation in Agriculture Sector Development
Agriculture and related activities constitute the bedrock of most countries in the SADC Region, and exports from the sector are important foreign exchange earners for these countries. Many countries in SADC are home to the world’s richest agricultural resources. As a result, several Governments in the region view that foreign investments in agriculture cultivation would lead to possible benefits for rural poor, including the creation of a potentially significant number of farm and off-farm jobs development of rural infrastructure, and social improvements, leading to povertyreduction. Moreover,nationalGovernments with a view to addressing the serious issue of food shortage have been framing policies towards attracting investors in the agricultural sector to tackle food, employment and sustainability crises. If these countries could frame and implement their agricultural policies in such a way that diversifies output, boosts productivity, and promotes strong linkages with other economic sectors and serves broad social policy objectives, then the region could easily overcome its underdevelopment and be on a path of development.
Indian companies can explore the possibilities of investment such as joint ventures or contract farming, setting up agro processing firms and investments in key stages of value chains. India’s investment could result in improving the agricultural sector of the host country through skill development, job creation, technological upgradation, supply of quality inputs like seed, better supply chain management, and biotechnology. India’s transfer of knowledge/ technology could help these countries to deal with the problem of food crisis. Indian scientific and agricultural research institutions have assisted many entrepreneurs for developing their business ideas in SADC countries. Indian investors could also focus on providing quality infrastructure to enhance the farm productivity in these countries.
Towards this end, the LOCs extended by the Exim Bank of India to SADC countries, which are earmarked for agriculture, irrigation and related projects, would also serve to contribute towards development of the agricultural and related sectors in the region.
• Development of Manufacturing Sector
Development of manufacturing sector in SADC member states is very important for the development and growth of the region. The dependence of many of the SADC member states on primary commodity exports, combined with reliance on manufactured imports has negatively affected the growth of the region. Also the recent global economic crisis has reduced development assistance and private capital flows to the region. Hence, development of a strong manufacturing sector is necessary. At present, Africa’s share in global manufacturing production and trade is very small. Furthermore, the manufacturing sector does not have strong links to the primary and service sectors. India could support SADC countries in creating productive capacity-building through various support and training programmes and technical cooperation. Government of India is helping these countries to build up on their manufacturing sectors through various policies and programmes, normally announced during India-Africa summits.
• Natural Resource Development
With many of the countries in SADC are endowed with mineral wealth and natural resources, enhanced bilateral cooperation for development/exploration of natural resources in these countries could benefit both India and SADC. Mineral production and development constitute a significant part of many SADC countries, and remain a key factor in their future economic growth. The SADC region has a majority of the world’s known resources of platinum, chromium and diamonds, as well as a large share of the world’s bauxite, cobalt, gold, phosphate and uranium deposits. For instance, South Africa’s mineral wealth is significant, with gold, platinum, coal, iron and diamonds being some of its key exports; while in the case of D R Congo, besides rich deposits of copper, cobalt, zinc, and diamonds, there are vast deposits of gold, considered to be the richest undeveloped gold deposits in Africa; Namibia has large reserves of uranium and is a leading global producers.According to World Gold Council, despite challenges India’s consumer demand for gold was the second-highest in the world (accounting for 27 per cent of the world gold demand), after China in 2015. In light of these, increased cooperation between India and the resource-rich countries in Africa and specifically SADC countries in developing/ exploring natural and mineral resources, with bilateral arrangements such as buy-back arrangements, could be an important strategy to enhance Indo-SADC commercial relations.
• Cooperation in Infrastructure Development
An important area of bilateral cooperation could be infrastructure development in African countries, especially SADC countries. Investment in infrastructure development, due to an increasing need for better infrastructural facilities, coupled with the endeavour of SADC countries for rapid economic growth, could prove to be a mutually rewarding area of bilateral cooperation. The lack of adequate infrastructure across Africa is currently holding back its GDP growth. Lack of forward and backward linkages between among different modes of transportation, declining air connectivity, poorly equipped ports, ageing rail networks, and inadequate access to all-season roads are key problems facing many of the SADC economies. Areas that hold immense investment opportunities include development of highways and roadways, development of railway networks and power systems, which would also help in regional integration, and the African continent at large, to a great extent. Large Indian construction companies could explore business opportunities to meet the infrastructural requirements in SADC member states, also contributing largely to economic development in the host countries.
Further, India could intensify its ongoing cooperation in training, capacity building, consultancy and project implementation through concessional credit in infrastructure areas, including water supply management, maritime connectivity, road and railway construction and upgrading. Thus supporting Africa’s Program for Infrastructure Development in Africa (PIDA) and enhancing cooperation in the Blue/Ocean Economy.
• Cooperation in Energy and Power Generation
Another area, which holds immense potential for investment and cooperation, is electricity generation and power transmission. While most Member States of SADC have abundant energy resources, insufficient use of existing energy systems has resulted in effective generation of electricity which is less than installed capacity due to drought, lack of maintenance and rehabilitation and also general system losses of electricity which includes transmission and distribution. As a result, energy production and consumption varies widely throughout the region. With industrial productivity steadily increasing in the region, the World Bank anticipates the demand for electricity to increase by 40 per cent over the next 10 years.
In this regard, the Southern African Power Pool is a key achievement of both Regional Integration and increased access to electricity. At present, nine SADC Member States have connected together their power grids, creating a rudimentary but competitive energy market. In doing so, the Southern African Power Pool has expanded trade in electricity, reduced costs, and improved energy stability throughout the region. Witnessing the benefits to participating Member States, SADC’s Regional Energy Sector Programme aims to incorporate the other outlying SADC Member States into the Southern African Power Pool, extending grid connections to encompass the whole region and furthering the benefits of a regional energy market.
To further enhance development of the energy infrastructure, SADC encourages investment in the region’s electricity infrastructure, especially in electricity plants, transmission lines, coal depots, and nuclear demonstration plants. Towards this end, the LOCs extended by the Exim India to countries in SADC, which are earmarked for power generation and transmission projects, would also serve to contribute towards development of the energy sector and power generation and transmission.
• Focus on Information Technology (IT) Development
The use of various electronic marketing technologies is necessary to improve and develop different sectors, but it largely depends on Internet access and penetration rates in countries, which is still at a backward stage in most of the SADC countries. With the strength and capability that India possesses in the realm of Information Technology sector, Indian IT firms could explore the opportunities in SADC countries, and focus on investing in subsidiaries or joint ventures in the areas of e-governance, financial services and e-education. Indian companies could also share their expertise in providing software programmes and services for banks and financial institutions in the region. For instance, Indian companies, such as NIIT, Aptech, karROX which already have presence in SADC countries, could expand their network of training centers in other SADC countries. Designing specialized e-learning courses on the web for providing technological assistance, manufacturing process know-how, troubleshooting and other technical areas also present opportunities. Such initiatives would help industry and commerce, promote education in remote areas, create employment opportunities and provide healthcare to remote areas in the region, thereby contributing to overall development of nations in the region.
• Cooperation in MSME Sector
At present MSMEs (micro, small and medium enterprises) make up the majority of businesses in Africa and especially in SADC and there is enormous scope for the development of this sector. SME sector development in the SADC region is constrained by a number of factors like lack of accessibility to modern technology, limited access to international markets, lack of management skills and training and lack of finance. Towards developing entrepreneurship and human capability, India could share its expertise and experience with countries in SADC, particularly in the SME sector wherein India has developed successful SME clusters. An important element in this direction could be for delegations from these countries to visit India to study success factor of SME clusters in India, and developing similar clusters in their countries based on resource and skill endowments. SME financing is another area where India could support this sector.
• Investment in Human Resource Development
An associated area of bilateral cooperation could also be investing in human resource development. Human resource development is recognised as the premiere need of most SADC member states. Businesses focusing on health, education and skill development are more likely stable businesses, which are in increasingly high demand in many countries, due to their direct impact on improving the standard of life. Towards this end, SADC member countries could also tie up with Indian institutions such as the Central Food Technological Research Institute (CFTRI), Mysore and Entrepreneurship Development Institute of India (EDI), Ahmedabad and National Small Industries Corporation Ltd. (NSIC), New Delhi. Further, Indian institutions could also share their expertise in the fields of export capability creation in the region, institutional strengthening and export development in the form of technical assistance and sharing of expertise through site visits. In the third India- Africa Forum Summit in 2015, India announced US$ 600 million grant assistance, including 50,000 scholarships for enhancing skills, training and learning. Indian investors could also help SADC governments in setting up various higher education institutes, universities and provide scholarships to students for various exchange programmes like Study India Programme, which could improve the quality of education in these countries. This type of academic arrangements between Indian and SADC universities will boost academic mobility between both regions.
• Developing Linkages with Investment Promotion Agencies/Chambers of Commerce
Besides streamlining their investment regimes, many countries in the region have set up specialised investment promotion agencies/Chambers of Commerce to promote and facilitate inflow of foreign investment into these countries, while also serving as one-stop-shop for investment related activities. In light of the key role of these institutions, building closer cooperation and linkages with these investment promotion agencies in SADC would serve to enhance access to information about investment opportunities in the region. Such relationship would serve to enhance knowledge about potential areas for investments in the region.
• Focus on Multilateral Funded Projects
Besides participating in investment activities that are promoted by the respective governments of countries in SADC, Indian companies could also endeavor to participate in multilateral funded projects. Multilateral institutions such as the World Bank and the African Development Bank (AfDB) support and fund a number of projects in Africa and SADC. They broadly cover areas such as agriculture and related activities; infrastructure development such as roads, telecommunication, postal services, electricity, water supply and sanitation; mining and quarrying; rural and urban development; environment and natural resource development; health care and education; financial market development; and tourism development.
Thus, for India, with countries in the SADC region emerging as important trade and investment partners, and the need of these countries for strategic partnership in their developmental and growth endeavours, sharing of experiences in capacity building, investments and endeavours in growth-inducing sectors in SADC member states could prove to be strategic in fostering and enhancing long term commercial relations as also presence in SADC member states.
Related News


Namibia Annual Trade Statistics Bulletin 2015
Foreign trade statistics play an important role in Namibia’s economy as it measures values and quantities of goods that, by moving into or out of a country, add or subtract from a nation’s material stock of goods. Foreign trade statistics are essential for the formulation of monetary, fiscal, commercial and regional integration policies. More importantly, in the Southern African Customs Union (SACU), reliable import statistics are crucial when it comes to revenue sharing among member states.
Since Namibia’s independence, government policy has been to develop, promote and diversify the country’s exports as well as reducing its reliance on foreign goods. It also helped to expand and consolidate market shares of existing markets and penetrate new markets. Prior to independence, trade flow between Namibia and the rest of the world was not independently recorded.
Since 1990, positive developments have taken place, both in the particulars recorded and the methods of recording. Computerization of procedures at the Directorate of Customs and Excise in the Ministry of Finance continues to enhance the timely dissemination and analysis of trade statistics through prompt transfer of captured trade data at Customs to the NSA.
This bulletin presents the annual trade statistics for 2015.
Key developments
Revisions
Revisions to trade data are made every month. This occurs when a new monthly data file is uploaded into the database with additional information from previous months. In some months, revisions are negligible while in other months they are significant.
Table 1 shows revisions made to 2014 data after more complete data became available.
Total exports and imports for the year 2014 were revised slightly upward from N$64.5 billion to N$64.7 billion, and from N$90.7 billion to N$92.1 billion, respectively. These revisions resulted in the deficit to swing up to N$27.4 billion from N$26.2 billion reported earlier.
Trade balance
Namibia continued to record an unfavorable trade balance, with 2015 recording the highest trade deficit amounting to N$39.2 billion in ten years since 2006. The trade deficit widened by 43.1 percent to N$39.2 billion compared to a revised figure of last year in which the deficit was estimated to be N$27.4 billion. The deficit widened as expenditure on imports expanded by 6 percent while export revenue dropped by 9.8 percent.
Trade balance in Namibia averaged to a deficit of N$11 billion from 2006 till 2015, it reached an all-time high with a surplus of N$2.6 billion in 2006 and a record low with a deficit of N$39.2 billion during the period under review.
In 2015, the largest deficits were recorded with South Africa (N$50.7 billion), China (N$4.3 billion), Bahamas (N$2.1 billion), India (N$1.6 billion) and Germany (N$1.2 billion) and the biggest trade surpluses with Botswana (N$10.8 billion), Switzerland (N$6.5 billion), Spain (N$2.3 billion), Angola (N$2.2 billion) and France (N$1.3 billion).
Expenditure on imports rose up to N$97.6 billion, from N$92.1 billion last year, as spending on mineral fuels, electrical machinery, copper ores and articles of iron or steel improved.
On the other hand, the overall value of exports fell to N$58.4 billion down from N$64.7 billion in the preceding year, mainly due to lower sale of minerals such as copper ore and zinc. In addition, vehicle sales also dented overall export revenue.
Exports to key markets
During the year 2015, Namibia’s overall exports declined by N$6.3 billion or 9.8 percent to N$58.4 billion compared to N$64.7 billion registered in 2014, this was mainly due to a contraction in foreign demand for domestic goods mainly by Angola, USA, Canada and Germany. The bulk of the exports, valued at N$38.6 billion were destined to Botswana, South Africa, Switzerland, Spain and Angola. Export revenue derived from these countries grew by 12.6 percent to N$38.6 billion when compared to N$34.3 billion recorded during the preceding year. In addition, these markets accounted for 66 percent of Namibia’s total export earnings, up from 53 percent a year earlier.
Botswana topped Namibia’s export destination with N$13.1 billion which translates to 21.5 percent increase from N$10.7 billion obtained a year earlier, as Botswana’s demand for diamonds, mineral fuels and oils and; processed fish rose. South Africa followed in the second position with (19.5 percent) then Switzerland with (15.3 percent) and finally Spain with (4.3 percent). However, exports to Angola fell by 44.7 percent to N$2.6 billion from N$4.7 billion a year ago. In addition, exports to the USA fell by (52.1 percent), Mozambique by (42.4 percent), Canada by (29.8 percent), German by (27.7 percent) and Singapore by (69.5 percent). Exports to the Export Processing Zone (EPZ) also dented Namibia’s overall export earnings.
Imports from key markets
During the year 2015, goods imported into Namibia increased by N$5.5 billion to N$97.6 billion, from N$92.1 billion a year earlier. South Africa, China, Switzerland, Botswana and Bahamas were the main suppliers of goods to Namibia during the period under review. The overall value of imports from these countries increased by 21.5 percent translated to N$75.1 billion when compared to N$61.8 billion witnessed in the year 2014. These markets accounted for 77 percent of total imports in 2015, down from 67 percent last year.
The strongest growth in the value of imports was mainly observed from Zambia, Peru and China. Overall imports from these markets grew to N$9.5 billion compared to N$4.5 billion recorded last year, as domestic demand for copper cathodes, cereals and sugar from Zambia; copper ores from Peru and ships, vessels, boilers, articles of iron or steel from China increased.
Namibia continues to depend on South Africa as a major source of imports, as the import bill from that country continues to grow.
In 2015, the import bill rose by 19.8 percent to account for N$62 billion compared to N$57.8 billion in the preceding year. Substantial increases in the value of imports were observed from Switzerland at 66.5 percent, Botswana at 19.4 percent and India at 12.7 percent. In the case of Switzerland, the increase was mainly caused by copper ores, boilers and vehicles, on the other hand, diamonds, vehicles, pharmaceuticals and; mineral fuel and oils influenced the increase in the value of imports from Botswana. Interestingly, Namibia recorded an increase in the overall value of imports from India, but this time around fish imports influenced the growth in imports from that country.
Namibians’ value of imports from some markets declined, the strongest drop was mainly observed from Germany (35.8 percent), the Bahamas (30.6 percent) and DRC (22.6 percent).
Top export products
Namibia’s top five leading export commodities in 2015 were diamonds, copper cathodes, fish, copper ores and zinc. Overall export earnings generated from these commodities increased by 9.7 percent to N$42.2 billion, up from N$38.4 billion obtained a year earlier, making these commodities to account for 72 percent of total export revenue in the year under review, up from 59 percent as compared to the preceding year.
Diamond continues to dominate the export market, in 2015 it accounted for 33 percent of overall exports and increased by 18.3 percent from last year due to high demand from Botswana and South Africa. In contrast, diamond exports to the Export Processing Zone (EPZ), Belgium, USA and Switzerland contracted. The strongest growth in exports among the aforementioned commodities was observed in the value of copper cathodes which rose to N$8 billion, from N$3.5 billion a year earlier as a result of external demand from Switzerland that grew by more than double, from N$3.5 billion a year ago to N$7.5 billion in 2015. In addition, high foreign demand for copper cathodes by Italy, North Korea, China, RSA, Saudi Arabia and Germany was also the cause for a relatively sharp increase in the overall value of copper cathodes exported which subsequently moved up three places to occupy the second place as Namibia’s top export earner for 2015.
On the other hand, the strongest decline in exports was reflected in the value of vehicles, zinc, and copper ores. Total revenue from exports derived from the aforesaid commodities fell by 35 percent to account for N$9.1 billion in 2015, down from N$14 billion a year earlier. In addition, the decline in export revenue was also due to lower sales of boilers (a decline of 38 percent), electrical machinery and equipment (declined by 12.6 percent), salt and cement (declined by 17.5 percent) and vessels (declined by 96.6 percent).
Fish exports
Namibia is a net fish exporting country. Thus, fish continues to be Namibia’s number one export revenue earner in terms of food items. Overall, fish forms part of the top five major export commodities by value. Namibia’s export revenue generated from fish averaged N$5.4 billion for the period 2006 till 2015, reaching an all-time high of N$7.1 billion in 2014, and a record low of N$3.2 billion, below average in 2006. The strongest growth in fish exports was recorded in 2008 and 2013, in which fish exports rose by 32.6 percent and 22.8 percent respectively.
Slight declines in fish exports were recorded in 2010, 2011 and 2015. In 2015, fish exports fell by only 1 percent to N$7 billion, from N$7.1 billion recorded a year ago. This decline can be attributed to low foreign demand of fish by Angola, Germany, Netherlands, Mozambique, Italy and DRC while fish exports to South Africa and Zambia increased.
Top re-exports products
Re-exports are exports of foreign goods, which have been previously imported into Namibia for different reasons. The overall value of re-exported commodities declined in 2015 by 27.8 percent to N$9.6 billion, when compared to N$13.3 billion recorded a year earlier. Copper cathodes, diamond, vehicles, boilers and copper ores were the most reexported commodities in 2015 in terms of value. In addition, the value of these commodities combined rose from N$3.8 billion last year to N$7.4 billion in 2015, and this represents 96 percent growth. Furthermore, the above mentioned commodities accounted for 77 percent of total re-export in 2015, down from 28.5 percent in the previous year.
Copper cathodes moved two places up to occupy the first position as Namibia’s top re-export commodity from the third position it occupied last year, and was mainly re-exported to Switzerland. On the other hand, re-export of vessels was the major cause for a decline in the overall value of re-exports, as it dropped by 96.6 percent to N$0.3 billion, when compared to N$9 billion witnessed a year ago.
Top import products
In 2015, mineral fuel and oils; vehicles, boilers, electrical machinery and copper ores dominated the list of imports to Namibia. The overall import value rose by 6 percent as domestic demand for foreign goods increased in 2015 to N$97.6 billion from N$92.1 billion registered a year earlier. These commodities accounted for 44.8 percent of total import expenditure in 2015, up from 38.8 percent compared to the preceding year, moreover, the overall import bill for the above-mentioned commodities rose 22.4 percent to N$43.7 billion from N$35.7 billion recorded a year earlier.
The strongest growth in imports was observed in the value of imported mineral fuel and oils which increased by 143 percent to N$14.2 billion, from N$5.8 billion obtained a year ago. Subsequently, mineral fuel and oils moved up three places to occupy the first position as Namibia’s major import commodity. Furthermore, imports of copper ores also increased substantially, while the increase in the importation of electrical machinery was minimal.
Despite the overall increase in the import bill, Namibia recorded a decline in imports of commodities such as vehicles, boilers, vessels and diamonds. The strongest decline was reflected in the value of imported vessels which fell by 66.2 percent (from N$12 billion to N$4 billion) and diamonds by 32.5 percent (from N$3.9 billion to N$2.6 billion).
Trade by economic regions
Exports
The Southern African Customs Union (SACU) maintained its position as Namibia’s number one export market, a position it held for the past ten years. Export revenue from this region grew by 25 percent to account for N$24.4 billion in 2015 from N$19.5 billion recorded a year earlier. In addition, SACU accounted for 28 percent of total exports to selected regions, up from 25 percent obtained in the previous year.
The European Union (EU) was Namibia’s second largest export market. This is as a result of a 17 percent growth in export revenue from that market to N$9.4 billion in 2015, from N$8 billion last year. In addition, the EU accounted for 10.6 percent of total exports, slightly up from 10.2 percent compared to a year earlier.
EFTA (Iceland, Liechtenstein, Norway and Switzer-land) occupied the third position as one of the largest export destinations for Namibia. Exports to this market also rose by 13.8 percent to N$8.986 billion, from N$7.896 billion recorded a year earlier. Additionally, export earnings accounted for 10 percent of overall export revenue, similar to its contribution last year. Furthermore, export revenue from the Common Market for Eastern and Southern Africa (COMESA) also rose, from N$3.7 billion reported in 2014 to N$4.3 billion in 2015.
On the other hand, the combined export revenue from SADC-Non-SACU and BRIC (Brazil, Russia, India and China), dropped by 14 percent to account for N$9.6 billion, when compared to N$11.2 billion recorded in 2014.
Imports
During the year under review, Namibia mostly imported from the SACU region compared to other economic regions. Import expenditure from SACU increased by 19.7 percent to N$64.6 billion compared to N$54 billion recorded a year ago. In addition, the import bill from SACU accounted for a share of 40 percent of total imports in 2015, similar to what was recorded a year ago.
BRIC regional grouping occupied the second position as Namibia’s major source of imports, as domestic demand from this region rose by a staggering 60 percent to account for N$8.8 billion, compared to N$5.5 billion registered a year ago. Subsequently, BRIC moved one place up to replace the EU as one of the major import source for Namibia, from the third place in 2014.
In addition, BRIC accounted for 5.4 percent share of total imports to Namibia, down from 4.1 percent share it accounted for in the preceding year.
The EU followed in the third place with imports valued at N$6.5 billion in 2015, this represents a 25.7 percent decline when compared to N$8.8 billion worth of imports recorded a year earlier. Furthermore, the region accounted for 4 percent of total imports, down from 6.5 percent recorded a year ago. SADC-Non-SACU nations occupied the fourth position as Namibia’s source of imports. The expenditure on imports to this region grew by 47 percent to N$5.2 billion in 2015, up from N$3.5 billion recorded a year ago. In addition, COMESA and EFTA also contributed significantly as Namibia’s source of imports during the period of review.
Trade by mode of transport
Exports
In 2015, the majority of Namibia’s export goods were transported via sea, however, the overall value of goods exported via this transport mode dropped by 28 percent to account for N$22.1 billion, when compared to N$30.1 billion reported a year ago. In addition, sea transport accounted for 38 percent of Namibia’s total exports, down from 47 percent recorded in the preceding year.
Similarly, the value of goods transported via road also dropped. However, the drop in exported goods via road was minimal when compared to the drop of exports via sea.
It dropped by only 8 percent to account for N$17.7 billion in 2015, from N$19.1 billion recorded in the preceding year. Moreover, the percentage share of exports via road remained relatively constant over the two periods.
Despite the decline in exports via sea and road, goods exported through air transport rose by 28 percent to account for N$18.5 billion, this is N$4.1 billion higher than what was reported a year ago. Additionally, exports via this mode accounted for 32 percent of total exports transported, down from 22 percent recorded in the past year.
Imports
The majority of imports to Namibia were transported by road, thus imports by road transport rose by 6 percent to account for N$57.9 billion compared to N$54.5 billion registered in 2014. The value of imports via road accounted for 59 percent of total imports to Namibia, which is similar to its percentage contribution in the year 2014.
Also, the total value of imports by Sea rose by 5 percent to account for N$34.6 billion in 2015, when compared to N$33 billion recorded in 2014.
It accounted for 36 percent of total imports in the period under review, also similar to what was reported in the previous year.
The value of goods imported via air grew the most, with 8 percent to account for N$4.6 billion from N$4.3 billion recorded in the previous year. Furthermore, the contribution of air transport was constant at 4.7 percent of total imports for both years.
Conclusion
Namibia recorded a negative trade balance valued at N$39.2 billion in 2015, it widened by 43 percent from N$27.4 billion reported in 2014.
During the period under review, Namibia’s key export markets were mainly Botswana, South Africa, Switzerland, Spain and Angola. On the other hand Namibia’s imports were mainly sourced from South Africa, China, Switzerland, Botswana and the Bahamas.
Major exported commodities were: diamonds, copper cathodes, fish, copper ores and zinc. Similarly, the aforementioned commodities including vehicles and boilers were the top reexports.
On the other hand, major import commodities were: mineral fuel and oils; vehicles, boilers, electrical machinery and equipment; and copper ores.
In terms of economic regions, Namibia’s export destinations in 2015 were SACU, Non-SACU-SADC, EU and EFTA. Imports were also mostly sourced from the same economic regions with SACU dominating followed by BRIC, EU, and then EFTA.
Namibia exported most commodities via sea while most commodities were imported via road. Air transport also played a vital role in both the exports and imports of commodities.
Related News


ATF 2016: President Kagame calls for a prosperous, stable and equitable Africa
Economic transformation happens through a positive change in the mind-set of the people, said President Paul Kagame when he addressed delegates on the second and final day of the African Transformation Forum (ATF) in Kigali, Rwanda.
The ATF was organized by the African Center for Economic Transformation (ACET) and the Government of Rwanda.
He told the approximately 250 delegates from all parts of Africa and the globe that in terms of transformation, “we really only have two strategic tools in my opinion: One, let’s change how people think; and two, let’s shape how resources are allocated and later on utilized.”
On changing mind-sets, he told the audience: “this challenge is not technical. It is political and social because it’s about people. It’s about developing a mind-set of urgency, ownership, responsibility and service as well as, quite frankly, the mind-set of money-making and long term investing.”
Citizens, he said, bear most of the risks – and gains – of transformation. “They have to be included in the decisions and understand the benefits of transformation – because success comes from what they do every day.”
President Kagame said the launching of the Coalition for the Transformation of Africa promised to be an innovative and promising outcome of the gathering. But he cautioned: “One way to avoid it becoming a venue for more talking among like-minded elites is to build in an element of outward-facing service in the work of each chapter.”
He also agreed that the ACET motto: ‘transformation in a generation’ was achievable and added: “We all want a prosperous, stable and equitable Africa and we want it as soon as possible. Period. This contrasts so radically with Africa’s past and present that we rightly speak of the need for transformation in the real sense.”
Everything, he said “starts with a clear and even very simple vision for the future that everyone understands and agrees on”. He told the delegates that Rwanda’s experience “has taught us some important things: you don’t need to have all the answers or all the funds to get started. Constantly assess and correct course, but don’t wait for perfection or rescue.”
Alluding to Africa’s often haphazard implementation of policies, he said: “If we know where we want to go and what has to be done to get there, then why do we seem stuck when it comes to implementation?” A wish list, he warned, “is not a strategy for getting things done: it is a recipe for an endless loop of conferences and declarations.”
On the role of the state and the market in the economic life of a country, he argued that in the African context, “we can grow very old waiting for the invisible hand of the market to work its magic. Government often must lead, catalyze, support, and invest by bringing in partners to fix market failures and mitigate risk.”
Referring to worries about the decline of overseas development aid (ODI) expressed by some speakers during the Forum, he said it was not the decline of aid that Africa should be worried about now – the continent should have seen that coming; we need to be more worried about how the money was invested when it was available.
The projected reduction in ODI, he argued, could be seen as a paradox where it was “a very bad thing, but also a very good thing.” It had helped many needy people, but the process itself has led to dependency. “There has been a cycle where we have invested in perpetuating a problem.”
In terms of international trade relations, he added: “We actually already have much of what we need right here in Africa. We will never win by discounting the quality of our own products and our people.”
Expanding on pathways to transformation, he said: “We have to stay adaptable and flexible. Plans and frameworks should not become a barrier to action or to course corrections. Mistakes will be made along the way and money wasted. But that should not be the end of the road – it serves a purpose if it helps to discover the most effective approach more quickly and build public understanding and unity of purpose.”
K.Y. Amoako, the president of ACET said that in order for transformation to happen, it was necessary to galvanize all sections of the population – “it must become a movement” he stressed. He added that the Coalition for the Transformation of Africa, which was launched at the Forum, would be part of that movement. “We talk about Africa but we are a sum of different countries. Every country can move at its own pace but we need to push collectively.
Closing Address by President Paul Kagame
African Transformation Forum (ATF)
Let me start by welcoming you all again to Rwanda for the inaugural African Transformation Forum. I thank you for being here and contributing to this very noble cause.
I would also like to thank Dr Amoako for taking the initiative to convene this forum here in Kigali, with commendable support from the Ford and MasterCard Foundations.
The focus of this event mirrors what we are working to achieve in Rwanda, our wider region, and all across Africa, and we are happy to be associated with it going forward.
I know that the deliberations over the past two days have been fruitful. As you conclude later on, allow me therefore to offer a few thoughts about where we are going and how we will get there.
Everything starts with a clear and even very simple vision for the future that everyone understands and agrees on. We all want a prosperous, stable, and equitable Africa. And we want it as soon as possible. Period.
This contrasts so radically with the African past and present that we rightly speak of the need for transformation in the real sense.
That is easy to say, but making it happen is understandably going to be harder. However it can become reality within our lifetimes, as the detailed work presented in this Forum illustrates.
This is step two: a focused set of concrete and measurable outcomes to target, gaps to bridge, and barriers to remove, like electricity, skills, access to finance, agricultural productivity, technology, manufacturing, trade, and so on.
So if we know where we want to go and what has to be done to get there, then why do we seem stuck on implementation?
First of all, a wish list is not a strategy for getting things done. It is a recipe for an infinite loop of conferences and declarations. I am glad Dr Amoako mentioned something to that effect earlier.
The institutions and individuals represented in this room are full of wisdom, talent, and knowledge, yet cannot do everything or even a small part of what needs to be done. We simply do not have the money, time, or information.
You and I do not implement the transformation agenda. Everyone does, collectively, even without necessarily being coordinated.
Beyond a certain level of complexity, we really only have two strategic tools in my opinion.
One, let’s change how people think. Two, shape how resources are allocated and later on utilised.
Let me share a few points, drawing on the experience of my own country.
Rwandans are ordinary people with an extraordinary history.
Twenty-two years ago, Rwanda’s very survival was at stake and everything was a priority.
We figured it out by doing it, because we had no choice. Help took years to arrive or was not appropriate to our circumstances. We had to start with our own resources and ideas, and in fact our desire to get out of the mess and chaos our country was in.
This taught us some important things.
You don’t need to have all the answers or all the funds to get started. Constantly assess and correct course, but don’t wait for perfection or rescue.
As we began to turn our attention to economic transformation, these habits and lessons served Rwanda well. They have become part of who we are and how we approach challenges.
First, transformational change happens at the level of mindsets. This was certainly true for rebuilding our national unity. But it is valid for creating prosperity as well.
This challenge is not technical; it is political and social because it is about people. A mindset of urgency, ownership, responsibility, and service as well as quite frankly the mindset of money-making and long-term investing.
Citizens bear most of the risk of transformation. They have to be included in the decisions and understand the benefits because success comes from what they do every day.
So we need mechanisms that include everybody and encourage things to move forward.
Second, no institution or individual has all the resources or answers. The right strategy is to use our limited means to send clear signals to the market and to partners about how best to allocate and utilise these resources.
Funds will come to join and scale up good initiatives that are underway. There is a lot of cash in this world looking for a useful function, both in terms of profit and social impact.
We often fall short on things that governments are generally not very good at anywhere: managing big infrastructure projects, picking winners in the economy, and so forth.
In the African context, however, we can grow very old waiting for the invisible hand of the market to work its magic.
Government often must lead, catalyse, support, and invest by bringing together partners to fix market failures and mitigate risk.
Examples in Rwanda include our growing conference and events infrastructure, as well as our provision of broadband internet and our laptop production partnership with Positivo BGH.
But ideally this should be done using conducive economic incentives and logic rather than trying to produce and implement directly.
Furthermore, and I hope this came out in your discussions here, or will, we actually already have much of what we need right here in Africa. We will never win by discounting the quality of our own products and our people.
Finally, we have to stay adaptable and flexible. Plans and frameworks should not become a barrier to action or to course correction.
Mistakes will be made along the way and money wasted. But that should not be the end of the road. It serves a purpose if helps to discover the most effective approach more quickly, and builds public understanding and unity of purpose.
Neither business nor government can afford to try one idea, wait a few years to see how it works, then scrap it and start the cycle again.
By working together, with an understanding of the strategic environment, we can speed up progress.
The Coalition for Transformation in Africa, and thank you Dr Amoako for this, promises to be an innovative outcome of this gathering.
One way to avoid it becoming a venue for more talking among like-minded elites is to build in an element of outward-facing service to the work of each chapter.
Our minister earlier on gave background and mentioned that aid is declining. First, I think it was bound to decline at some point. If anyone thought it would be there forever, we see it will not.
Second, we should have drawn lessons long ago from our history and experiences. It is not even the decline that we should be worried about now. We needed to be more worried about how it was being invested.
Aid has been very helpful because it addressed many problems, and helped many needy people, who by the way are also a product of bad aid investment, with the numbers of people who need aid increasing. There has been a cycle where we have invested in perpetuating the problem.
So the decline of aid is a paradox: a very bad thing but also a very good thing. Let me rest my case there.
I am looking forward to the best ideas that can come from this room given the knowledge, talent, and experience that mark the backgrounds of the people here.
I thank you very much for your kind attention.
Related News


South African Reserve Bank Quarterly Economic Review – March 2016
Domestic economic developments
Domestic output
Economic activity in South Africa increased at a slightly slower pace in the fourth quarter of 2015. Following a contraction in the second quarter of 2015, annualised growth in real gross domestic product (GDP) accelerated to 0,7 per cent in the third quarter before slowing marginally to 0,6 per cent in the fourth quarter. The slower growth in the final quarter could be attributed to a decline in the real value added by the secondary sector alongside steady, but slower, growth in the tertiary sector. The real value added by the primary sector declined further over the period albeit at a somewhat slower pace than in the third quarter.
Excluding the contribution of the drought-affected agricultural sector, annualised growth in real GDP decelerated marginally from 1,1 per cent in the third quarter of 2015 to 0,9 per cent in the final quarter.
Consistent with the sluggish quarter-to-quarter growth registered throughout the year, growth in real gross domestic production moderated further from 1,5 per cent in 2014 to a disappointing 1,3 per cent in 2015 – with the exception of 2009, the slowest rate of expansion during the past 17 years. On average, annual growth amounted to 2,3 per cent between 2010 and 2015 compared with an annual average rate of 4,0 per cent in the ten years prior to 2009.
The lacklustre performance of the South African economy in 2015 could, to an important extent, be attributed to subdued business and consumer confidence levels, muted demand conditions, ongoing supply-side constraints, a further decline in the prices of key export commodities, and the knock-on effects of the widespread drought conditions in many parts of the country.
Subsequent to a sharp contraction of 10,4 per cent in the third quarter of 2015, the real value added by the primary sector declined further, albeit at a slower pace in the final quarter of the year. Agricultural output shrank at a faster pace, alongside an increase in the real output of the mining sector.
Activity in the agricultural sector contracted unabatedly throughout 2015. In addition to the devastating effect of dry weather conditions on field crops as well as animal and horticultural production, the country also experienced record-high temperatures in the final quarter of 2015, further scorching arable land. Livestock production held up well over the period, mitigating the rate of contraction. Negative growth in all four quarters of 2015 accordingly culminated in an annual decline of 8,4 per cent for the year as a whole.
Early indications do not bode well for the 2015/16 planting and production season. According to the February 2016 estimates of the Crop Estimate Committee, South African producers are expected to plant roughly a 26 per cent smaller area than in the preceding year. Preliminary estimates of the commercial maize crop for the 2015/16 season amount to 7,3 million tons as opposed to 9,9 million tons in the 2014/15 season. Taking into account the available stock of white and yellow maize, the country might have to import white and yellow maize to meet annual domestic commercial consumption of roughly 9,6 million tons.
Mining production picked up in the final quarter of 2015; annualised growth in real output accelerated from -9,8 per cent in the third quarter of 2015 to 1,5 per cent in the final quarter, supported by the higher production of especially diamonds and nickel. The production volumes of coal, platinum-group metals and building materials increased at a more moderate pace despite further steps to enhance operational efficiencies, while the production of gold, manganese ore and other metallic minerals contracted over the period.
On an annual basis, growth in the real output of the mining sector turned around from -1,6 per cent in 2014 to 3,0 per cent in 2015, adding 0,2 percentage points to growth in aggregate GDP. Mining production in 2015 benefited mainly from the normalisation in platinum production following improved productivity and cost-containment measures introduced at a number of platinum mines after the protracted labour strike in the industry in 2014. In addition, in some of the other domestic mining subsectors work disruptions as a result of wage disputes were less prevalent in 2015. Despite this improved performance, the industry continued to be adversely affected by infrastructural constraints, policy uncertainty, ongoing labour tension, declining commodity prices, rising operational costs, and a global oversupply of certain mining products.
Owing mainly to the disappointing performance of the manufacturing sector, the real value added by the secondary sector switched from an annualised increase of 3,3 per cent in the third quarter of 2015 to a decline of 1,5 per cent in the fourth quarter. Activity in the electricity, gas and water as well as in the construction sectors strengthened over the period.
The quarter-to-quarter pickup in the real value added by the manufacturing sector in the third quarter of 2015 was short-lived as real manufacturing output contracted anew in the fourth quarter. Weighed down by lower production of primarily durable manufactured products, the real value added by the manufacturing sector contracted at an annualised rate of 2,6 per cent over the period – subtracting 0,3 percentage points from overall economic growth in the final quarter of 2015. Production volumes declined in the subsectors supplying basic iron and steel; non-ferrous metal products and machinery; electrical machinery; and motor vehicles, parts and accessories and other transport equipment. The weaker demand for processed metals affected by, among other factors, the slowdown in economic activity in China probably weighed on the production of these products.
By contrast, the production of non-durable goods rose over the period in line with increased consumer demand for these products. Increases were mainly evident in the production of petroleum and chemical products and of food and beverages. Consistent with the somewhat higher production levels in a number of subsectors, the utilisation of production capacity in the manufacturing sector increased from 80,1 per cent in the third quarter of 2015 to 80,5 per cent in the final quarter.
Annual growth in the real output of the manufacturing sector tapered off between 2010 and 2012, and thereafter remained virtually unchanged up to 2015; real output rose by only 0,1 per cent in 2015. Activity in the South African manufacturing sector continued to be negatively affected by weak domestic and global demand, the slowdown in activity in the agricultural sector, declining commodity prices affecting the mining sector, and electricity-supply constraints.
Prices
The sharp decline in international commodity prices in 2015 led to a subdued global inflationary environment and contributed meaningfully to a more benign domestic inflation outcome than initially anticipated. In addition, domestic demand and output growth slowed throughout the year, reducing inflationary pressures further. Consequently, headline consumer price inflation moderated from an annual average of 6,1 per cent in 2014 to 4,6 per cent in 2015 – the first moderation in annual average headline consumer price inflation in four years.
Despite the decline in crude oil and other international commodity prices, consumer price inflation accelerated gradually from a recent low of 3,9 per cent in February 2015 to 4,8 per cent in November, affected by the gradual depreciation in the exchange rate of the rand throughout the first eleven months of the year. However, inflationary pressures intensified towards the end of 2015 and in the opening months of 2016 as food price inflation quickened in response to the severe drought conditions and as the exchange rate of the rand depreciated sharply.8 As such, consumer price inflation quickened to 6,2 per cent in January 2016.
Driven largely by falling international commodity prices, most measures of domestic producer price inflation moderated markedly in 2015. Producer price inflation for mining products decelerated substantially from an annual average of 4,2 per cent in 2014 to an annual average of -4,1 per cent in 2015. Likewise, producer price inflation for final manufactured goods more than halved from an annual average of 7,5 per cent in 2014 to 3,6 per cent in 2015, while producer price inflation for intermediate manufactured goods moderated from an annual average of 8,2 per cent in 2014 to a mere 0,8 per cent in 2015, as price inflation slowed across a broad range of product categories. When measured as an annual average, producer price inflation for agriculture, forestry and fishing products moderated from 5,3 per cent in 2014 to 4,7 per cent in 2015. However, producer price inflation for electricity and water – both administered prices – remained elevated throughout 2015, accelerating somewhat from an annual average of 9,9 per cent in 2014 to 11,1 per cent in 2015.
Notwithstanding the slowing annual average rates of inflation, most measures of producer price inflation accelerated in recent months; producer price inflation for final manufactured goods and intermediate manufactured goods amounted to 7,6 per cent and 3,8 per cent respectively in January 2016. Driven largely by steep drought-induced agricultural price increases, producer price inflation for agriculture, forestry and fishing products accelerated markedly in the closing months of 2015, amounting to 23,6 per cent in January 2016.
International food prices declined for a fourth consecutive year in 2015, with the international food price index of the United Nations Food and Agriculture Organization (FAO) averaging 19,1 per cent below its level in 2014 on account of abundant global food supplies and an appreciating US dollar. However, when expressed in rand terms, the year-on-year change in the FAO international food price index accelerated notably from July 2015 onwards, amounting to 19,1 per cent in January 2016 following the marked depreciation in the exchange rate of the rand in recent months. Abundant supplies and high inventory levels following, among others, the removal of export taxes in Argentina and continued good crop prospects, resulted in international cereals prices falling further in 2015 with the FAO international cereals price index being 15,4 per cent lower than in 2014. However, despite lower international cereal prices, the dramatically reduced 2015 domestic maize crop following the most severe drought in decades resulted in domestic maize and wheat prices soaring to all-time high levels and occasionally trading above import parity levels.
Domestic agricultural producer food price inflation accelerated notably from -3,0 per cent in January 2015 to 25,9 per cent a year later. The quickening in agricultural producer food price inflation resulted almost entirely from a marked acceleration in price inflation for cereals and other crops, from -17,5 per cent in January 2015 to 79,2 per cent in January 2016, as the severe drought conditions ravaged crops in South Africa’s primary maize- and wheat-producing areas. The rise in domestic maize prices was exacerbated by expectations that South Africa might have to import roughly 4 million tons of maize in the wake of the drought. Conversely, producer price inflation for live animals moderated notably from 11,5 per cent in May 2015 to 1,0 per cent in January 2016 due to the increased selling and slaughtering of herds in drought-stricken areas.
Foreign trade and payments
International economic developments
Global economic growth moderated notably from an annualised rate of 3,5 per cent in the third quarter of 2015 to 1,9 per cent in the fourth quarter. The pace of growth almost halved in emerging-market economies, driven primarily by weaker economic conditions in China, India and Russia. In advanced economies, economic activity slowed largely due to a sharp moderation in US economic growth and a contraction of economic activity in Japan.
The International Monetary Fund (IMF) lowered its 2016 global growth forecast by 0,2 percentage points to 3,4 per cent in its January 2016 World Economic Outlook Update. In particular, growth projections for emerging-market and developing economies were scaled down by 0,2 percentage points to 4,3 per cent. The recession in Brazil was estimated to be more protracted than previously expected, while growth prospects for major oil- and other commodity-exporting countries such as Nigeria, Russia, Saudi Arabia and South Africa also weakened.
According to the CPB Netherlands Bureau for Economic Policy Analysis, world trade volumes (calculated as the three-month average of world exports relative to that in the preceding three months) grew by 1,9 per cent in December 2015, slower than the 4,7 per cent rate of increase in November. Growth in emerging-market export volumes slowed significantly to 2,2 per cent in December from 7,8 per cent in the previous month. Export volume growth of advanced economies also eased marginally to 1,6 per cent in December.
Weaker growth in emerging-market economies and increased US shale oil production have put downward pressure on commodity prices, especially energy prices. The price of Brent crude oil receded sharply to a twelve-year low of below US$30 per barrel in January 2016, more than 75 per cent lower than the US$115 per barrel recorded in mid-2014. The lifting of most trade sanctions on Iran as well as reports of elevated crude oil inventory levels added to concerns about an oversupply in the oil market. However, oil prices increased to levels above US$36 per barrel towards the end of February after China lowered the reserve requirements of banks to boost its slowing economy and crude output from the US and OPEC fell. Brent crude oil futures prices for delivery in the second and third quarters of 2016 were trading at around US$37 per barrel and US$39 per barrel respectively.
Current account
South Africa’s annual trade deficit with the rest of the world halved between 2014 and 2015 despite a widening trend in the second half of 2015. The trade balance switched from a surplus in the second quarter of 2015 to deficits of R22 billion and R57 billion in the third and fourth quarters respectively. A contraction in merchandise export volumes alongside increased domestic demand for foreign-produced goods largely shaped developments on the trade account in the final quarter of 2015. Notwithstanding the widening of the trade deficit to 1,4 per cent of GDP in the fourth quarter of 2015, the trade deficit narrowed on an annual basis from 1,8 per cent of GDP in 2014 to 0,9 per cent in 2015.
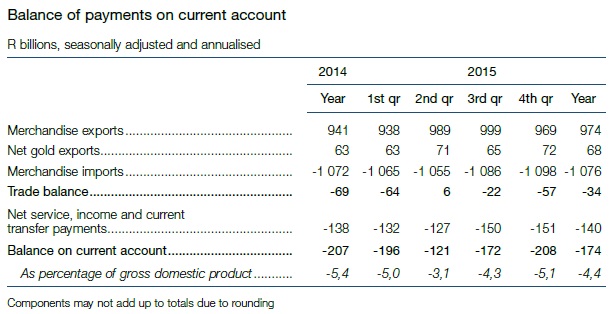
The traditional shortfall on the services, income and current transfer account with the rest of the world broadened slightly from the third to the fourth quarter of 2015, exacerbating the weakening of the trade balance over the period. The deficit on the current account of the balance of payments thus expanded from 4,3 per cent of GDP in the third quarter of 2015 to 5,1 per cent in the fourth quarter. On an annual basis, the deficit narrowed from 5,4 per cent of GDP in 2014 to 4,4 per cent in 2015.
Even though the depreciation in the exchange value of the rand boosted the export earnings of domestic producers, the benefits thereof were more than fully negated by a further decline in the international prices of South African export commodities in the fourth quarter of 2015. The rand price of merchandise exports (excluding gold) consequently fell by 0,4 per cent in the final quarter of 2015. The US dollar price of non-gold export commodities declined by 7,7 per cent in the fourth quarter of 2015 following a drop of 8,5 per cent in the preceding quarter as the prices of copper and nickel decreased further on account of, among other factors, weakening manufacturing output in China. Reflecting prolonged global oversupply, the dollar price of iron ore receded further by 14,9 per cent in the fourth quarter of 2015. At the same time, the dollar prices of coal and platinum also edged lower although the price of coal was expected to increase somewhat during the winter season in the Northern hemisphere. For 2015 as a whole, the US dollar price of a basket of South African-produced non-gold export commodities fell by no less than 21,5 per cent following a decline of 9,4 per cent in 2014.
After increasing for five consecutive quarters, the volume of merchandise exports contracted by 2,6 per cent in the fourth quarter of 2015, affected by a decrease in the volume of mining and manufactured exports. Nonetheless, as a ratio of real GDP, the volume of merchandise exports surged from 23,1 per cent in 2014 to 25,2 per cent in 2015, indicative of the somewhat better performance of South African producers in international markets amid a more competitive exchange rate of the rand.
Having advanced in the preceding two quarters, the value of merchandise exports decreased by 3,0 per cent in the fourth quarter of 2015. This decline was mainly evident in exports destined for Europe, with exports to trading-partner countries in Africa moving sideways. By contrast, muted increases were recorded in the value of merchandise exports to the American and Asian continents over the period.
Even though the value of non-gold mining exports to most regions shrank in the final quarter of 2015, non-gold mining exports to Africa and Europe in particular contracted sharply, declining by 18 per cent and 19 per cent respectively in the fourth quarter of the year. Declines were largely noted in the value of manganese and chromium ores and related concentrates as well as in the platinum-group metals over the period. In the category for manufactured exports, a decrease in the value of exported vehicles and transport equipment as well as in machinery and electrical equipment more than offset increases in the value of exported chemical products and processed food, beverages and tobacco.
The value of agricultural exports advanced by 11,7 per cent in the fourth quarter of 2015, supported by increases in the sales of vegetable products as well as live animals and animal products. The impact of the intensifying drought conditions in South Africa on food security and livestock was evident in a significant decline in the value of net maize exports in the first three quarters of 2015; net exports rose somewhat in the fourth quarter.
The London fixing price of gold declined from US$1 125 per fine ounce in the third quarter of 2015 to US$1 104 per fine ounce in the fourth quarter, or by 1,8 per cent. Owing to, among other factors, the depreciation in the exchange value of the rand, the average realised rand price of gold rose by 9,7 per cent over the same period. Combined with a 1,5 per cent increase in the physical quantity of net gold exports in the final quarter of 2015, the export proceeds of South African gold producers advanced by 11,3 per cent over the period. On an annual basis, net gold export earnings rose from R63 billion in 2014 to R68 billion in 2015.
Having increased by 1,4 per cent in the third quarter of 2015, the volume of merchandise imports rose by 1,8 per cent in the fourth quarter as the domestic demand for imported mining products and manufactured goods increased despite a moderation in domestic economic growth and the sustained depreciation in the exchange value of the rand over the period. The rise in the volume of mining imports largely reflected a sharp increase in mineral products, particularly crude oil, amid substantially lower international crude oil prices. At the same time, the physical quantity of imported refined oil products, particularly distillate fuels, and other mining products contracted somewhat in the fourth quarter of 2015.
The physical quantity of non-oil imports declined by 2,5 per cent in the fourth quarter of 2015 following an increase of 1,7 per cent in the third quarter. The physical quantity of manufactured imports rose marginally in the fourth quarter despite the importation of fewer railway locomotives compared with the preceding quarter. Over the same period, the volume of agricultural imports declined marginally. As a ratio of real gross domestic expenditure, the volume of total merchandise imports increased from 25,3 per cent in 2014 to 26,5 per cent in 2015.
Despite the substantial weakening in the exchange value of the rand in the fourth quarter of 2015, the rand price of imports fell by 0,7 per cent, pushed lower by the sharp decline in the international price of crude oil over the period. The slightly lower import price, together with the increase in the overall import volume, resulted in a 1,1 per cent increase in the value of merchandise imports in the fourth quarter of 2015.
South Africa’s terms of trade improved marginally in the fourth quarter of 2015 as overall merchandise export prices moved broadly sideways while that of merchandise imports declined. The terms of trade nonetheless deteriorated from 2014 to 2015.
The shortfall on the services, income and current transfer account widened further from R150 billion in the third quarter of 2015 to R151 billion in the fourth quarter. Despite this deterioration, the annual shortfall on the account narrowed marginally from 3,6 per cent of GDP in 2014 to 3,5 per cent of GDP in 2015.
The widening of the deficit in the final quarter of 2015 could largely be attributed to a decrease in gross dividend receipts from abroad; gross dividend payments to non-resident investors also declined, but not to the same extent. Overall, growth in dividend payments to the rest of the world slowed to about 5 per cent in 2015, following robust growth of almost 19 per cent recorded in 2014. In fact, the pace of increase in dividend payments in 2015 was the slowest since 2010. At the same time, dividend receipts from abroad continued to taper off from a recent peak in the first quarter of 2014. For the year 2015 as a whole, gross dividend receipts nevertheless increased by almost 23 per cent following robust annual growth of, on average, almost 46 per cent between 2012 and 2014. As a ratio of total receipts on the services, income and current transfer account, gross dividend receipts advanced from 12,5 per cent in 2012 to 20,6 per cent in 2015. The continued strong growth in dividend receipts has accordingly helped to moderate the deficit in this area over an extended period of time.
The widening in the shortfall on the income account in the fourth quarter was countered by an increase in net travel receipts. Tourism spending by foreign tourists probably benefited from the abrupt weakening in the exchange value of the rand during the fourth quarter of 2015. However, notwithstanding higher spending during the final quarter of 2015, expenditure by foreign travellers rose by less than 4 per cent during the calendar year 2015 as a whole compared with an increase of almost 14 per cent in 2014.
Net payments in the category ‘other services’ were further elevated by higher gross payments related to intellectual property. Since such payments are made to non-residents on a regular basis, the depreciation in the exchange value of the rand probably inflated these numbers in the final quarter of 2015.
International investment position
South Africa’s net international investment position (assets minus liabilities) changed from a negative value of R131 billion at the end of June 2015 to a positive value of R113 billion at the end of September 2015 – marking the first positive net international investment position ever to be recorded since measurement of South Africa’s international investment position started at the end of 1956.
The market value of South Africa’s foreign liabilities (inward investment) declined from R5 174 billion at the end of June 2015 to R5 164 billion at the end of September, while the market value of South Africa’s foreign assets (outward investment) amounted to R5 276 billion at the end of September 2015 compared with R5 043 billion at the end of June. The volatility and decline in domestic and global equity markets as well as the marked depreciation in the exchange rate of the rand resulted in a modest decline in the market value of South Africa’s foreign liabilities and a substantial increase in the market value of the country’s foreign assets at the end of September 2015 compared with the end of June 2015.
As a ratio of South Africa’s GDP, the country’s foreign liabilities decreased from 132,7 per cent at the end of June 2015 to 131,0 per cent at the end of September; the country’s foreign assets rose from 129,4 per cent to 133,8 per cent over the same period. This brought the country’s net international investment position to a positive 2,9 per cent of GDP at the end of September 2015 compared with a negative ratio of 3,4 per cent at the end of June.
Related News

Latest issue of UNCTAD Investment Policy Monitor
The Monitor finds that 25 countries took 41 investment policy measures between October 2015 and February 2016. The share of liberalization and promotion measures was 85 per cent – broadly in line with last year’s average.
These policy measures show a continued move towards improving entry conditions, reducing restrictions and facilitating foreign investment. Geographically, countries from Asia and the Commonwealth of Independent States (CIS) – such as Indonesia, Kazakhstan, Myanmar and Vietnam – took the lead on these policies. In terms of policy types, measures related to “entry/establishment” were predominant.
Among the most important policy measures are the adoption of new investment laws in Myanmar, the Republic of Serbia and South Africa, the adoption of a comprehensive plan for full investment liberalization in selected sectors in Indonesia, the partial removal by India of foreign direct investment (FDI) restrictions in 15 major sectors, and the expansion by Kazakhstan of the “One-Stop Shop” approach to all investors.
Regarding international investment policies, UNCTAD found that countries concluded ten new international investment agreements (IIAs), bringing the total number of IIAs to over 3,280 at the end of February 2016.
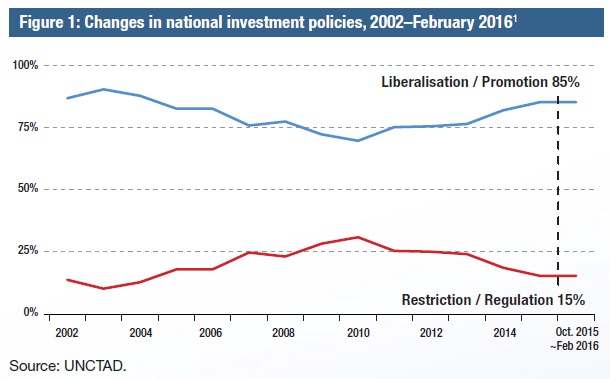
The new treaties are five bilateral investment treaties (BITs) and five “other IIAs”, including the Trans-Pacific Partnership (TPP). At least six IIAs entered into force.
Countries also continued to negotiate new IIAs, including megaregional ones, such as the African Continental Free Trade Area (CFTA), the Regional Comprehensive Economic Partnership (RCEP) or the European Union-United States Transatlantic Trade and Investment Partnership (TTIP).
New treaties continue to include provisions safeguarding the right to regulate, while protecting investment, as well as other elements mentioned in UNCTAD’s Roadmap for IIA Reform and in UNCTAD’s updated Investment Policy Framework for Sustainable Development.
UNCTAD’s Investment Policy Monitor, together with the Global Investment Trends Monitor and UNCTAD’s policy databases (the Navigator), is a regular online policy brief that provides the investment and development community with country-specific, up-to-date information about the latest developments in foreign investment policies both at the national and international levels.
This Investment Policy Monitor will support expert deliberations at the 16 March UNCTAD Expert Meeting that will take stock of IIA reform.
Related News

ATF 2016: Institutional, human capital development vital for African transformation
Strengthening institutions and providing enough capacity to professional individuals will be a catalyst to help transform the African economies that have recently been crippled by various factors and now, experts are agitating for drastic change to move the continent forward.
This was highlighted in the inaugural African Transformation Forum in Kigali, Rwanda where economic experts, policy makers and government officials from all over the continent are gathered to deliberate on the best mechanisms on how Africa can be economically transformed in a way that positively impacts the poor citizens as well as growing the economies.
The two day forum organized by Africa Center for Economic Transformation in partnership with the Rwandan government is was held between 14 and 15 March 2016.
Participants agree that there is a need for the African governments to adjust and embark on providing adequate capacity building as this will drive the economic transformation that is urgently needed to facilitate Africa to compete favorably in global trade and investment.
Prof. Emmanuel Nnadozie, Executive Secretary of the African Capacity Building Foundation (ACBF), who is an economist and development expert, believes that there is need for African higher learning institutions to embark on practical science studies rather than theoretical learning which he said plays a pivotal role in economic development.
“We must look at human capital as a driver to economic change. If you don’t have skills you cannot talk about transformation and this means that we need universities to educate young Africans on how to solve their problems economically and move this continent to another level,” he said.
Prof. Nnadozie who was among the discussants on the topic “Implementing National Transformation Strategies” further observed that political will was another essential factor to accelerate economic transformation on the continent.
“Governments with visionary leaders will always perform better compared to others. That’s why we need a political will to monitor the performance of institutions,” he said.
He commended the Rwandan government that is currently looked at as a model in terms of establishing feasible initiatives that have facilitated the sustainable growth urging that it’s imperative for other countries to come up with developmental initiatives that will help provide employment opportunities to the citizens.
With the support of ACBF and other organizations, Rwanda has managed to maintain the annual growth rate of 7 percent.
Some of the challenges highlighted that continues to hinder the economic development in the continent include poor leadership that harbor corruption, incompetent skilled labor which is considered to be caused by nepotism in governments, inadequate infrastructure like poor roads network as well as political instabilities that leads to destruction of already existing infrastructural facilities and loss of lives.
Experts further noted that, governments spend much time in discussion on how to eliminate some challenges like trade barriers which eventually fail to work due to poor political commitment urging that there is a need to rethink and strategize other moves that can see the purging of all existing trade barriers in place to promote intra-regional trade.
However, despite some challenges, some African countries have really managed to soldier on by initiating new mechanisms to steadily keep their economies growing. Rwanda, Ethiopia, Mauritius are among those that have kept the economic growth candle burning despite the dark historical challenges.
In the case of Rwanda, Claver Gatete the Rwandan Minister of Finance and Economic Planning mentioned that the country initiated a new economic strategy which acts as an economic guiding model for the country. This, according to the minister, has yielded positive results.
“The story however is just beginning; we are taking deliberate steps to push this transformation faster through our Economic Development and Poverty Reduction Strategy. This hinges on increasing trade especially exports, facilitating urbanization, developing a green and climate resilient economy; increasing productivity and youth employment with particular emphasis on off-farm employment, rural development including raised agricultural productivity and accountable governance which provides a platform for citizens to engage and find innovative solutions to development issues,” he said while making a presentation during the Forum.
The Economic Development and Poverty Reduction Strategy (EDPRS) was designed to move the country to middle income class by 2020.
Dr Kingsley Y. Amoako the President of African Center for Economic Transformation noted that for transformation to take place, a public-private partnership and mobilization of both domestic and external resources would be required.
“Transformation cannot take place without committed and ethical leadership. It cannot take place without sustained engagement between the public and private sectors. It cannot take place without improved coordination between key organs of government in strategy formulation and implementation. It cannot take place without the mobilization and judicious allocation of both domestic and external resources,” he noted.
Related News


New trade portal makes import, export easier, cheaper in Botswana
With the launch of a new trade portal, the Botswana government is lowering trade costs, decreasing time to do business and easing customs cooperation when moving goods and services in and out the country. With the support of the World Bank, the portal is also expected to contribute towards increased trade and investment.
The main objective of the Botswana Trade Portal is to make it easier for traders and investors to comply with regulatory requirements associated with the importation and exportation of goods as well as in helping Botswana comply with the World Trade Organization (WTO) Bali Agreement on Trade Facilitation.
“The establishment of this trade portal forms a key part of the World Bank Group's new Country Partnership Framework for Botswana to help generate export-led diversified growth and employment, as well as the promotion of private sector-led jobs intensive growth,” said Guang Zhe Chen, World Bank country director for Botswana.
The trade portal is a web-based database system, which makes all cross-border trade regulatory information available at a stroke of a key. The information includes all laws, prohibitions, restrictions, technical standards, the entire commodity classification and tariffs, all procedures for license and permit application and clearance, copies of all forms as well as plain language instructions.
The trade portal also enables traders to see, in response to a single query, all the obligations they need to comply with to import or export a specific good. It was developed in response to a request by the Government of Botswana through its trade agency, the Botswana Investment and Trade Centre (BITC).
“With all this information readily available and clear instructions and flow-charts on how to export or import, traders should find it quicker and easier to be compliant and discharge all their formalities with fewer time consuming interactions,” said Vincent Seretse, Botswana Minister for Trade and Industry. Seretse added that the trade portal would boost Botswana’s efforts to become a globally competitive player in the overall share of trade in the world.
Financed through a $600k grant, the Botswana Trade Portal is supported through the World Bank Group (WBG) Trade Facilitation Support Program. The WBG’s global facility helps countries implement their international commitments on trade facilitation, specifically following the new WTO Trade Facilitation Agreement. After Mauritius, Botswana was the first mainland country in Africa to ratify this agreement, which states that every member of the WTO has an obligation to publish on the internet all trade related information promptly and transparently.
The WBG’s Trade Facilitation Support Program also helps countries to implement reforms aimed at increasing trade, investments, and job creation. This support was matched by the technical efforts of the BITC, under the leadership of Chief Executive Officer Letsebe Sejoe, as well as the multiple of Botswana government trade-related agencies who played a critical part in the development of the portal.
“Making all of Botswana’s regulatory requirements for importing and exporting available to the private sector in an easily accessible, transparent and searchable format, is a key step forwards towards a simpler, faster and lower-cost investment climate,” said Richard Record, World Bank senior economist.
The Botswana Trade Portal is one part of the WBG’s efforts to help promote private sector-led, jobs-intensive growth in Botswana. The larger partnership between the government and the WBG reaches across a range of sectors, including social protection, health, education, water, transport and natural resource management.
Access the trade portal here.


