News
Namibia Annual Trade Statistics Bulletin 2015

Foreign trade statistics play an important role in Namibia’s economy as it measures values and quantities of goods that, by moving into or out of a country, add or subtract from a nation’s material stock of goods. Foreign trade statistics are essential for the formulation of monetary, fiscal, commercial and regional integration policies. More importantly, in the Southern African Customs Union (SACU), reliable import statistics are crucial when it comes to revenue sharing among member states.
Since Namibia’s independence, government policy has been to develop, promote and diversify the country’s exports as well as reducing its reliance on foreign goods. It also helped to expand and consolidate market shares of existing markets and penetrate new markets. Prior to independence, trade flow between Namibia and the rest of the world was not independently recorded.
Since 1990, positive developments have taken place, both in the particulars recorded and the methods of recording. Computerization of procedures at the Directorate of Customs and Excise in the Ministry of Finance continues to enhance the timely dissemination and analysis of trade statistics through prompt transfer of captured trade data at Customs to the NSA.
This bulletin presents the annual trade statistics for 2015.
Key developments
Revisions
Revisions to trade data are made every month. This occurs when a new monthly data file is uploaded into the database with additional information from previous months. In some months, revisions are negligible while in other months they are significant.
Table 1 shows revisions made to 2014 data after more complete data became available.
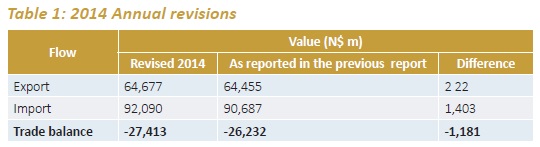
Total exports and imports for the year 2014 were revised slightly upward from N$64.5 billion to N$64.7 billion, and from N$90.7 billion to N$92.1 billion, respectively. These revisions resulted in the deficit to swing up to N$27.4 billion from N$26.2 billion reported earlier.
Trade balance
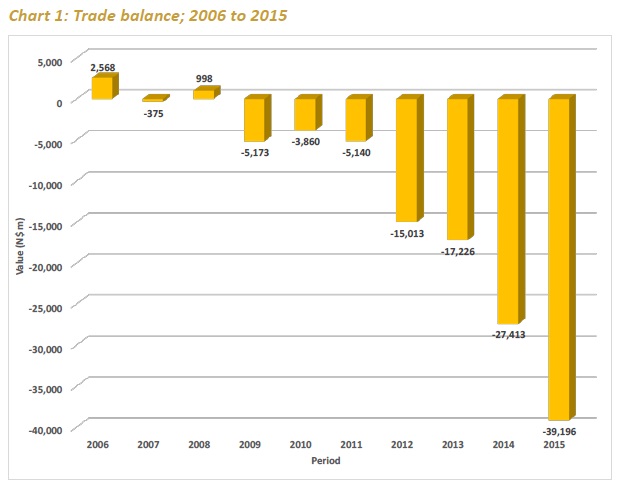
Namibia continued to record an unfavorable trade balance, with 2015 recording the highest trade deficit amounting to N$39.2 billion in ten years since 2006. The trade deficit widened by 43.1 percent to N$39.2 billion compared to a revised figure of last year in which the deficit was estimated to be N$27.4 billion. The deficit widened as expenditure on imports expanded by 6 percent while export revenue dropped by 9.8 percent.
Trade balance in Namibia averaged to a deficit of N$11 billion from 2006 till 2015, it reached an all-time high with a surplus of N$2.6 billion in 2006 and a record low with a deficit of N$39.2 billion during the period under review.
In 2015, the largest deficits were recorded with South Africa (N$50.7 billion), China (N$4.3 billion), Bahamas (N$2.1 billion), India (N$1.6 billion) and Germany (N$1.2 billion) and the biggest trade surpluses with Botswana (N$10.8 billion), Switzerland (N$6.5 billion), Spain (N$2.3 billion), Angola (N$2.2 billion) and France (N$1.3 billion).
Expenditure on imports rose up to N$97.6 billion, from N$92.1 billion last year, as spending on mineral fuels, electrical machinery, copper ores and articles of iron or steel improved.
On the other hand, the overall value of exports fell to N$58.4 billion down from N$64.7 billion in the preceding year, mainly due to lower sale of minerals such as copper ore and zinc. In addition, vehicle sales also dented overall export revenue.
Exports to key markets
During the year 2015, Namibia’s overall exports declined by N$6.3 billion or 9.8 percent to N$58.4 billion compared to N$64.7 billion registered in 2014, this was mainly due to a contraction in foreign demand for domestic goods mainly by Angola, USA, Canada and Germany. The bulk of the exports, valued at N$38.6 billion were destined to Botswana, South Africa, Switzerland, Spain and Angola. Export revenue derived from these countries grew by 12.6 percent to N$38.6 billion when compared to N$34.3 billion recorded during the preceding year. In addition, these markets accounted for 66 percent of Namibia’s total export earnings, up from 53 percent a year earlier.
Botswana topped Namibia’s export destination with N$13.1 billion which translates to 21.5 percent increase from N$10.7 billion obtained a year earlier, as Botswana’s demand for diamonds, mineral fuels and oils and; processed fish rose. South Africa followed in the second position with (19.5 percent) then Switzerland with (15.3 percent) and finally Spain with (4.3 percent). However, exports to Angola fell by 44.7 percent to N$2.6 billion from N$4.7 billion a year ago. In addition, exports to the USA fell by (52.1 percent), Mozambique by (42.4 percent), Canada by (29.8 percent), German by (27.7 percent) and Singapore by (69.5 percent). Exports to the Export Processing Zone (EPZ) also dented Namibia’s overall export earnings.
Imports from key markets
During the year 2015, goods imported into Namibia increased by N$5.5 billion to N$97.6 billion, from N$92.1 billion a year earlier. South Africa, China, Switzerland, Botswana and Bahamas were the main suppliers of goods to Namibia during the period under review. The overall value of imports from these countries increased by 21.5 percent translated to N$75.1 billion when compared to N$61.8 billion witnessed in the year 2014. These markets accounted for 77 percent of total imports in 2015, down from 67 percent last year.
The strongest growth in the value of imports was mainly observed from Zambia, Peru and China. Overall imports from these markets grew to N$9.5 billion compared to N$4.5 billion recorded last year, as domestic demand for copper cathodes, cereals and sugar from Zambia; copper ores from Peru and ships, vessels, boilers, articles of iron or steel from China increased.
Namibia continues to depend on South Africa as a major source of imports, as the import bill from that country continues to grow.
In 2015, the import bill rose by 19.8 percent to account for N$62 billion compared to N$57.8 billion in the preceding year. Substantial increases in the value of imports were observed from Switzerland at 66.5 percent, Botswana at 19.4 percent and India at 12.7 percent. In the case of Switzerland, the increase was mainly caused by copper ores, boilers and vehicles, on the other hand, diamonds, vehicles, pharmaceuticals and; mineral fuel and oils influenced the increase in the value of imports from Botswana. Interestingly, Namibia recorded an increase in the overall value of imports from India, but this time around fish imports influenced the growth in imports from that country.
Namibians’ value of imports from some markets declined, the strongest drop was mainly observed from Germany (35.8 percent), the Bahamas (30.6 percent) and DRC (22.6 percent).
Top export products
Namibia’s top five leading export commodities in 2015 were diamonds, copper cathodes, fish, copper ores and zinc. Overall export earnings generated from these commodities increased by 9.7 percent to N$42.2 billion, up from N$38.4 billion obtained a year earlier, making these commodities to account for 72 percent of total export revenue in the year under review, up from 59 percent as compared to the preceding year.
Diamond continues to dominate the export market, in 2015 it accounted for 33 percent of overall exports and increased by 18.3 percent from last year due to high demand from Botswana and South Africa. In contrast, diamond exports to the Export Processing Zone (EPZ), Belgium, USA and Switzerland contracted. The strongest growth in exports among the aforementioned commodities was observed in the value of copper cathodes which rose to N$8 billion, from N$3.5 billion a year earlier as a result of external demand from Switzerland that grew by more than double, from N$3.5 billion a year ago to N$7.5 billion in 2015. In addition, high foreign demand for copper cathodes by Italy, North Korea, China, RSA, Saudi Arabia and Germany was also the cause for a relatively sharp increase in the overall value of copper cathodes exported which subsequently moved up three places to occupy the second place as Namibia’s top export earner for 2015.
On the other hand, the strongest decline in exports was reflected in the value of vehicles, zinc, and copper ores. Total revenue from exports derived from the aforesaid commodities fell by 35 percent to account for N$9.1 billion in 2015, down from N$14 billion a year earlier. In addition, the decline in export revenue was also due to lower sales of boilers (a decline of 38 percent), electrical machinery and equipment (declined by 12.6 percent), salt and cement (declined by 17.5 percent) and vessels (declined by 96.6 percent).
Fish exports
Namibia is a net fish exporting country. Thus, fish continues to be Namibia’s number one export revenue earner in terms of food items. Overall, fish forms part of the top five major export commodities by value. Namibia’s export revenue generated from fish averaged N$5.4 billion for the period 2006 till 2015, reaching an all-time high of N$7.1 billion in 2014, and a record low of N$3.2 billion, below average in 2006. The strongest growth in fish exports was recorded in 2008 and 2013, in which fish exports rose by 32.6 percent and 22.8 percent respectively.
Slight declines in fish exports were recorded in 2010, 2011 and 2015. In 2015, fish exports fell by only 1 percent to N$7 billion, from N$7.1 billion recorded a year ago. This decline can be attributed to low foreign demand of fish by Angola, Germany, Netherlands, Mozambique, Italy and DRC while fish exports to South Africa and Zambia increased.
Top re-exports products
Re-exports are exports of foreign goods, which have been previously imported into Namibia for different reasons. The overall value of re-exported commodities declined in 2015 by 27.8 percent to N$9.6 billion, when compared to N$13.3 billion recorded a year earlier. Copper cathodes, diamond, vehicles, boilers and copper ores were the most reexported commodities in 2015 in terms of value. In addition, the value of these commodities combined rose from N$3.8 billion last year to N$7.4 billion in 2015, and this represents 96 percent growth. Furthermore, the above mentioned commodities accounted for 77 percent of total re-export in 2015, down from 28.5 percent in the previous year.
Copper cathodes moved two places up to occupy the first position as Namibia’s top re-export commodity from the third position it occupied last year, and was mainly re-exported to Switzerland. On the other hand, re-export of vessels was the major cause for a decline in the overall value of re-exports, as it dropped by 96.6 percent to N$0.3 billion, when compared to N$9 billion witnessed a year ago.
Top import products
In 2015, mineral fuel and oils; vehicles, boilers, electrical machinery and copper ores dominated the list of imports to Namibia. The overall import value rose by 6 percent as domestic demand for foreign goods increased in 2015 to N$97.6 billion from N$92.1 billion registered a year earlier. These commodities accounted for 44.8 percent of total import expenditure in 2015, up from 38.8 percent compared to the preceding year, moreover, the overall import bill for the above-mentioned commodities rose 22.4 percent to N$43.7 billion from N$35.7 billion recorded a year earlier.
The strongest growth in imports was observed in the value of imported mineral fuel and oils which increased by 143 percent to N$14.2 billion, from N$5.8 billion obtained a year ago. Subsequently, mineral fuel and oils moved up three places to occupy the first position as Namibia’s major import commodity. Furthermore, imports of copper ores also increased substantially, while the increase in the importation of electrical machinery was minimal.
Despite the overall increase in the import bill, Namibia recorded a decline in imports of commodities such as vehicles, boilers, vessels and diamonds. The strongest decline was reflected in the value of imported vessels which fell by 66.2 percent (from N$12 billion to N$4 billion) and diamonds by 32.5 percent (from N$3.9 billion to N$2.6 billion).
Trade by economic regions
Exports
The Southern African Customs Union (SACU) maintained its position as Namibia’s number one export market, a position it held for the past ten years. Export revenue from this region grew by 25 percent to account for N$24.4 billion in 2015 from N$19.5 billion recorded a year earlier. In addition, SACU accounted for 28 percent of total exports to selected regions, up from 25 percent obtained in the previous year.
The European Union (EU) was Namibia’s second largest export market. This is as a result of a 17 percent growth in export revenue from that market to N$9.4 billion in 2015, from N$8 billion last year. In addition, the EU accounted for 10.6 percent of total exports, slightly up from 10.2 percent compared to a year earlier.
EFTA (Iceland, Liechtenstein, Norway and Switzer-land) occupied the third position as one of the largest export destinations for Namibia. Exports to this market also rose by 13.8 percent to N$8.986 billion, from N$7.896 billion recorded a year earlier. Additionally, export earnings accounted for 10 percent of overall export revenue, similar to its contribution last year. Furthermore, export revenue from the Common Market for Eastern and Southern Africa (COMESA) also rose, from N$3.7 billion reported in 2014 to N$4.3 billion in 2015.
On the other hand, the combined export revenue from SADC-Non-SACU and BRIC (Brazil, Russia, India and China), dropped by 14 percent to account for N$9.6 billion, when compared to N$11.2 billion recorded in 2014.
Imports
During the year under review, Namibia mostly imported from the SACU region compared to other economic regions. Import expenditure from SACU increased by 19.7 percent to N$64.6 billion compared to N$54 billion recorded a year ago. In addition, the import bill from SACU accounted for a share of 40 percent of total imports in 2015, similar to what was recorded a year ago.
BRIC regional grouping occupied the second position as Namibia’s major source of imports, as domestic demand from this region rose by a staggering 60 percent to account for N$8.8 billion, compared to N$5.5 billion registered a year ago. Subsequently, BRIC moved one place up to replace the EU as one of the major import source for Namibia, from the third place in 2014.
In addition, BRIC accounted for 5.4 percent share of total imports to Namibia, down from 4.1 percent share it accounted for in the preceding year.
The EU followed in the third place with imports valued at N$6.5 billion in 2015, this represents a 25.7 percent decline when compared to N$8.8 billion worth of imports recorded a year earlier. Furthermore, the region accounted for 4 percent of total imports, down from 6.5 percent recorded a year ago. SADC-Non-SACU nations occupied the fourth position as Namibia’s source of imports. The expenditure on imports to this region grew by 47 percent to N$5.2 billion in 2015, up from N$3.5 billion recorded a year ago. In addition, COMESA and EFTA also contributed significantly as Namibia’s source of imports during the period of review.
Trade by mode of transport
Exports
In 2015, the majority of Namibia’s export goods were transported via sea, however, the overall value of goods exported via this transport mode dropped by 28 percent to account for N$22.1 billion, when compared to N$30.1 billion reported a year ago. In addition, sea transport accounted for 38 percent of Namibia’s total exports, down from 47 percent recorded in the preceding year.
Similarly, the value of goods transported via road also dropped. However, the drop in exported goods via road was minimal when compared to the drop of exports via sea.
It dropped by only 8 percent to account for N$17.7 billion in 2015, from N$19.1 billion recorded in the preceding year. Moreover, the percentage share of exports via road remained relatively constant over the two periods.
Despite the decline in exports via sea and road, goods exported through air transport rose by 28 percent to account for N$18.5 billion, this is N$4.1 billion higher than what was reported a year ago. Additionally, exports via this mode accounted for 32 percent of total exports transported, down from 22 percent recorded in the past year.
Imports
The majority of imports to Namibia were transported by road, thus imports by road transport rose by 6 percent to account for N$57.9 billion compared to N$54.5 billion registered in 2014. The value of imports via road accounted for 59 percent of total imports to Namibia, which is similar to its percentage contribution in the year 2014.
Also, the total value of imports by Sea rose by 5 percent to account for N$34.6 billion in 2015, when compared to N$33 billion recorded in 2014.
It accounted for 36 percent of total imports in the period under review, also similar to what was reported in the previous year.
The value of goods imported via air grew the most, with 8 percent to account for N$4.6 billion from N$4.3 billion recorded in the previous year. Furthermore, the contribution of air transport was constant at 4.7 percent of total imports for both years.
Conclusion
Namibia recorded a negative trade balance valued at N$39.2 billion in 2015, it widened by 43 percent from N$27.4 billion reported in 2014.
During the period under review, Namibia’s key export markets were mainly Botswana, South Africa, Switzerland, Spain and Angola. On the other hand Namibia’s imports were mainly sourced from South Africa, China, Switzerland, Botswana and the Bahamas.
Major exported commodities were: diamonds, copper cathodes, fish, copper ores and zinc. Similarly, the aforementioned commodities including vehicles and boilers were the top reexports.
On the other hand, major import commodities were: mineral fuel and oils; vehicles, boilers, electrical machinery and equipment; and copper ores.
In terms of economic regions, Namibia’s export destinations in 2015 were SACU, Non-SACU-SADC, EU and EFTA. Imports were also mostly sourced from the same economic regions with SACU dominating followed by BRIC, EU, and then EFTA.
Namibia exported most commodities via sea while most commodities were imported via road. Air transport also played a vital role in both the exports and imports of commodities.


