Search News Results
tralac’s Daily News Selection
Featured tweet, @selemani: 44 of the 55 African States belong to more than 1 regional economic community. Why the overlap?
Trade and integration policy workshops starting today: In Arusha: The Arusha Symposium, on the theme Beyond the Abuja Treaty: regional economic communities and continental integration; In Malabo: 2017 Congress of African Economists on the theme Growth, employment and inequalities; In Dubai: the Global Business Forum on Africa 2017
Starting tomorrow, in Abuja: Trade and Investment Facilitation Partnership Forum (with ECOWAS, UNCTAD)
Diarise: Boosting trade and development by tackling Africa’s supply chain challenges (16 November, Wilson Center, Washington: the event will be webcast)
Profiled downloads from Doing Business 2018: Region profile of Sub-Saharan Africa, Region profile of Southern African Development Community, Region profile of the East African Community. [Tomorrow’s selection will carry a set of country results and commentaries]
Profiled REC policy planning processes:
(i) COMESA: Intergovernmental Committee meeting opens. The 37th meeting of the COMESA Intergovernmental Committee opened in Lusaka on Monday. Zambia’s Minister of Commerce, Trade and Industry Mrs Margaret Mwanakatwe, who officially opened the meeting, said the implementation of regional commitments and full-scale participation of all member States in COMESA programmes requires improvement. “The low level of transposition of regional instruments at Member States level has negatively affected the implementation of various programme.” In this regard, there is need for Member States to implement agreed Summit Decisions. Minister Mwanakatwe appealed to member states to consider appropriate funding of the COMESA budget for us to sustain efforts made so far. She said: “Over the years, the resource envelope has continued to shrink. This has resulted in some of COMESA’s flagship programmes being discontinued and more are likely to follow.” The meeting was informed on the progress made towards the realization of a full free trade area. Currently 16 out the 19 countries have joined the free trade area since it was launched in 2000. The Secretariat is providing technical assistance the remaining countries to join the COMESA FTA.
(ii) EAC: Sectoral Council of Ministers responsible for EAC Affairs and Planning opens. The meeting will be capped by the Ministerial Session which will take place on Friday, 3rd November, 2017. Among the items on the agenda of the meeting are: report on the Implementation of previous decisions of the SCMEACP; report on the status of integration for the period July 2016 – June 2017; Progress Report on the Status of Implementation of the EAC Common Market Protocol; Progress Report on COMESA-EAC-SADC Tripartite Arrangement; Draft 5th EAC Development Strategy (2016/17-2020/21).
(iii) SADC: Ministers of Transport and Meteorology preview. The 2017 Southern Africa Community Development SADC senior officials meeting of ministers of transport and meteorology has commenced in Malawi’s capital Lilongwe with an appeal to delegates to prioritize regional interests. Principal Secretary in the Ministry of Transport and Public Works, Francis Chinsinga, made the appeal when he officially opened the meeting which is scheduled to end on 3 November. He said the key areas that the protocol on transport, communication and meteorology aims to achieve is for the SADC region to have compatible policies, legislation, rules, standards and procedures which cannot be achieved if member countries work in isolation and try to protect their interest. According to chairperson of the meeting Manare Mamabole delegates to the meeting have been grouped into sub-sectoral committees in order to develop procedures and assign duties as well as put in place systems for monitoring progress and addressing non-compliance regulations. She said the sub-sectoral committee meetings will recommend their outcomes and report the challenges encountered during implementation to the committee of ministers which will convene on Friday for guidance.
EAC Trade and Investment Report 2015 (EABC)
This EAC Trade and Investment Report (pdf) analyses the trade and investment flows in 2015. Its main purpose is to gauge EAC trade performance in the global macro-economic and trade contexts and particularly analyses the intra-EAC trade in goods for the year under review, EAC trade with the rest of the world, tax exemptions, revenue yield and investment flows of Partner States. It also highlights challenges and provides recommendations which inform policy direction. The EAC Trade and Investment Report for the last 11 years have shown that intra-EAC trade has grown from $1.5bn in 2005 to $5.1bn in 2015 with the highest level being $5.8bn in 2013. On the flipside of the positive performance over period since 2005, EAC intra-trade performance in 2015 depicted a downward trend with a decrease of 10% from $5.6bn in 2014 to $5.1b. Investment flows in 2015 also declined by 16.4% from the previous year although the total investment was nearly double than that of 2012 and 2013. Likewise the trade deficit with the rest of the world continued to increase in 2015. The one year disparity may not be a good measure for the future trends given that 2016 may have experienced a rebound in the fundamental parameters used in the reporting.
The EAC Trade and Investment Report 2015 reveals the challenges that impede trade in EAC as Non-Tariff Barriers (NTBs) that raised the cost of doing business; poor infrastructure at the ports and along the main transport corridors; exemption regime that distorts the implementation of the CET; low value addition in the Region that affects the export earnings of the Partner States; lack of human and financial resources by the implementing agencies such as the investment agencies; delays in conclusion of trade agreements; investment related policies and strategies that are not harmonized at the regional level; and cumbersome administrative and regulatory practices with regard to registering a business and getting licenses.
Lake Tanganyika Transport Programme: update
This workshop has been organised by the EAC Secretariat in collaboration with the Central Corridor Transport Facilitation Agency and the World Bank. The EAC is committed to delivering an integrated transport system and the Lake Tanganyika Transport Programme in particular. The Lake Tanganyika Transport Programme represents yet another coordinated initiative between Partners States, Development Partners and Regional Organizations to deliver an integrated, efficient and cost effective transport system for our countries and regions. Lake Tanganyika is uniquely placed to provide intermodal linkages between Tripartite Regional Economic blocks of EAC, COMESA and SADC and therefore a critical conduit not only for transport needs but also for wider economic benefits.
Tanzania: SAGCOT ought to go national (The Citizen)
The Minister for Agriculture, Dr Charles Tizeba, has said the Southern Agricultural Growth Corridor of Tanzania should be replicated in other regions after showing improvement of agricultural production in the southern highlands. Currently, the initiative has six clusters that cover eight regions in which Dr Tizeba said at the weekend it had uplifted smallholder farmers. “You have shown the way and you have the expertise. We can’t afford to see other regions languishing while we have a state-of-the-art agricultural initiative that needs to be shared across the board,” he said during the launch of Mbarali Cluster which comprises Mbeya and Songwe regions.
Too many police check points on Ghana’s international roads (GNA)
The Director of Tema Port, Mr. Edward Osei, has bemoaned the very high number of police check points on the Tema/Paga road. “There is supposed to be only two legal customs barriers from here to Burkina Faso. On our way we counted about fifty police blocks; there were a lot of them and we intend to tackle that immediately,” he said. He said this on Monday during the official launching of the second borderless road show in Ghana organized by the Ghana Shippers Authority, and the Borderless Alliance at the forecourt of Black Star Line, Tema. Mr Hamoiu, President of Borderless Alliance, Ghana, observed that the programme would begin a full week of fact finding and information dissemination and interactions with transport operators, traders and uniformed officers along the Tema/Paga road corridor, which is Ghana’s main road into Burkina Faso and the land locked countries in the Sahel region.
Bruce Byiers: Trade and food security in West Africa (ECDPM)
Though anyone working on the region is acutely aware of the need to take account of informal and unrecorded trade, for governments and external partners to take informal economic activity as a starting point rather than wishing it away is an important, positive development. But it is only one step forward, given the challenge then faced in actually designing and implementing suitable support programmes. Does SWAC’s mapping of cross-border policy networks offer a way to inform where to focus attention and efforts?
Paul Nugent, Isabella Soi: When customs reform hits the border - a comparison between East and West Africa (bordersandwine)
Across the continent, Customs reforms are following a broadly similar trajectory, driven in part by regional integration initiatives and in part also by global Customs conventions. The sequencing is often different and there are nuances of detail, but it is helpful to view these developments in a comparative light. One question that arises is how reforms are communicated down the administrative chain of command and how they are explained to the various ‘stakeholders’. Arguably, the best vantage point from which to address it is from the border itself where the practical business of Customs is transacted on a daily basis. This blog post is based on ongoing research on the Uganda/Kenya and Ghana/Togo borders.
What role for East African hydrocarbons in the global economy post-Paris COP21? (UNU-WIDER)
This broad-brush global picture has several consequences for East African hydrocarbon discoveries and how countries are preparing for these. First, the cost of producing natural gas in East Africa is high. There is a risk that the discoveries do not translate into competitive investment projects in an environment where prices are under pressure and the LNG market is facing fundamental structural change. Second, the region’s sociopolitical and socioeconomic environment is not sending positive signals to those contemplating investing in immobile assets. [The author: Evelyn Dietsche]
Mozambique: A political economy analysis (CMI)
In 2017, Mozambique was at its most critical moment since the end of the civil war, in a crisis-like cocktail of political, economic and social problems.This report uses a political economy analysis to shed light on some of the paradoxes that characterize Mozambique by mid-2017: Entrenched poverty, the resuscitated armed conflict/war, the trust crisis between the Mozambican (Frelimo) government and its development partners, the spiralling debt and the party-state. They are paradoxes, since just a few years ago Mozambique received praise as frontrunner to overcome those problems. Extract (pdf): The following changes in the political economy seem likely, as compared to the previous ten-year period:
(i) Mozambique will enter a period of high-debt, and worsening economy. This potentially increases the leverage of the state’s external financers and creditors (IMF, traditional donors, Chinese banks, Mozambican banks). That leverage also depends on their ability to coordinate an agenda, which raises questions about what they intend to use it for? Will the international community come together to ensure the extractive industries only, or to help set Mozambique up toward a more broad-based development? (ii) With the development of the LNG industry, large international petroleum companies and their consortia will have high stakes in the country. Seeking long-term profits, so their primary interest is in stability, not necessarily broad-based development. They will put pressure on donors and the government to serve their interests. (iii) Some novel mode of decentralisation (gubernatorial elections?) may change political dynamics in unpredictable ways. [The authors: Aslak Jangård Orre, Helge Rønning]
Nigeria plans $1bn crop-processing zone to boost exports (Bloomberg)
The Badeggi Crop Processing Zone in Niger state is expected to start in June next year, with an initial investment of $250m by a Turkish investor, deputy director at Abuja-based Nigerian Investment Promotion Council, Aminu Takuma, said in an Oct. 30 interview. Additional funds of $800m will follow and the investor will operate the park while owning a 60% stake, he said without identifying the Turkish partner, citing confidentiality obligations. The facility will process more than 750,000 metric tons of crops including rice, maize, yam, cassava, groundnuts and peas every year, according to the agency. The government plans to set up 15 similar crop zones across the country of more than 180 million people.
SA-DRC Investment and Trade Initiative (APO)
The Department of Trade and Industry will lead a delegation of 29 businesspeople to the DRC for the 8th Investment and Trade Initiative (ITI) scheduled to take place in Kinshasa and Lubumbashi from 6-11 November. According to the Minister of Trade and Industry, Dr. Rob Davies: “South Africa and DRC have the potential to trade at an optimal level in different sectors of the economy especially beneficiation and manufacturing. There is still work that needs to be done in terms of further strengthening commercial and investment relations and focusing on new collaboration and trade partnerships in key areas of the economies of the markets, and we are optimistic that the ITI will provide that platform,” says Davies. Sectors targeted for the ITI are agro-processing, built environment, mining capital equipment, energy, chemicals, pharmaceuticals and medical equipment.
Remove non-tariff barriers Zambia urges South Africa (Mwebantu)
- - -
Related News


EAC Trade and Investment Report 2015
This EAC Trade and Investment Report analyses the trade and investment flows in 2015. Its main purpose is to gauge EAC trade performance in the global macro-economic and trade contexts and particularly analyses the intra-EAC trade in goods for the year under review, EAC trade with the rest of the world, tax exemptions, revenue yield and investment flows of Partner States. It also highlights challenges and provides recommendations to inform policy direction.
The EAC Trade and Investment Report for the last 11 years have shown that intra-EAC trade has grown from $1.5 billion in 2005 to $5.1 billion in 2015 with the highest level being $5.8 billion in 2013. The Revenue collections have also continued to exhibit positive growth on year to year basis in all the Partner States. The EAC has also witnessed exponential growth in Foreign Direct Investment and Intra-EAC investment flows. Although not yet at the desired levels, the trend gives indication that EAC is becoming an attraction of viable investment projects. The flows depicted by these reports are supported by other empirical studies such as the Regional integration Index of 2016 carried out by Economic Commission for Africa and African Development Bank and the improved rankings in the Doing Business Reports of the World Bank.
On the flipside of the positive performance over period since 2005, EAC intra-trade performance in 2015 depicted a downward trend with a decrease of 10 percent from US$5.6 billion in 2014 to US$5.1 billion. Investment flows in 2015 also declined by 16.4% from the previous year although the total investment was nearly double than that of 2012 and 2013. Likewise the trade deficit with the rest of the world continued to increase in 2015. The one year disparity may not be a good measure for the future trends given that 2016 may have experienced a rebound in the fundamental parameters used in the reporting.
The EAC Trade and Investment Report 2015 reveals the challenges that impede trade in EAC as Non-Tariff Barriers (NTBs) that raised the cost of doing business; poor infrastructure at the ports and along the main transport corridors; exemption regime that distorts the implementation of the CET; low value addition in the Region that affects the export earnings of the Partner States; lack of human and financial resources by the implementing agencies such as the investment agencies; delays in conclusion of trade agreements; investment related policies and strategies that are not harmonized at the regional level; and cumbersome administrative and regulatory practices with regard to registering a business and getting licenses.
Executive summary
The East African Community is one of the fastest growing integration arrangements in Africa and is set to expand with the application of the Republic of South Sudan to join the bloc. During the year, the EAC continued its quest towards full economic integration with remarkable progress in the implementation of the Single Customs Territory (SCT) including the upgrade of Regional infrastructure especially the ports of Mombasa and Dar es Salaam, roads, airports and border posts. Implementation of the SCT is set to reduce the cost of doing business by eliminating duplication of processes.
EAC is also looking to improve trade beyond the SCT by promoting trade facilitation initiatives with other trading blocs. These initiatives include the EAC-EU EPAs, AGOA, COMESA-EAC-SADC Tripartite Agreement as well as the EAC-US Investment Partnership Agreement.
This EAC Trade and Investiment Report presents the status and analysis of the trade and investment sectors of the five Partner States in the context of the global trade and investment performance in 2015 as well as an analysis of the revenue performance. The data reveals that the East African Partner States economies continued to grow in 2015 despite the global economic slowdown that affected many economies.
The real GDP growth of the East African Region as a whole remained positive, averaging 5.7 percent over the year. Tanzania, Kenya and Uganda maintained positive growth while Rwanda and Burundi’s economic growth declined over the year. EAC has continued to experience a trade deficit with the Rest of the World (RoW). During 2015, the trade deficit for the EAC grew by 11.3 percent to US$ 23.4 billion up from US $21.0 billion in 2014. While, FDI inflows into the region decreased by 16.4 percent to US$ 7.2 billion from US$ 8.6 billion in 2014 as a result of a decrease in FDI to the United Republic of Tanzania and Uganda while there was growth of FDI inflows into Kenya and Rwanda.
Overall investment inflows into the EAC for 2015 were meagre by global standards accounting for only about one percent of global investment inflows during the year. To encourage investment promotion, the Region continued to offer exemptions and incentives that exempt from import duty and other charges of equivalent effect, imports for manufacture of goods destined for export markets. While the total duty foregone decreased by 0.8 percent to US$ 1.59 billion in 2015 from US$ 1.6 billion in 2014 as a result of elimination of some exemptions by Partner States, it was still substantial and negatively affected the total revenue yield of the Partner States.
In spite of the growth in trade and investment, 2015 exhibited continued sluggish performance that was witnessed in 2014. Trade in goods volumes as well as investment inflows remained flat or declined as a result of a number of challenges: Non-Tariff Barriers (NTBs) that raised the cost of doing business and affect intra-Regional trade which decreased by 10.0% in 2015 due to: poor infrastructure at the ports and along the main transport corridors; discretion in the implementation of the exemption regime that distorts the implementation of the CET; and low value addition in the Region that affects the export earnings of the Partner States. Also the Region is yet to develop a comprehensive investment strategy to promote all countries as a single investment destination.
National-level investment promotion agencies at the Partner State level are constrained by lack of human and financial resources and national governments still exercise cumbersome regulatory and administrative policies that impact negatively on investment promotion.
To mitigate this un-favourable trade position in EAC, the report proposes the following key policy recommendations:
-
Take deliberate steps to reduce the cost of doing business in order to boost exports and investments.
-
Adopt a more holistic and coherent approach to attract investment through development of policies that support investment promotion.
-
Conclude trade and investments agreements with key trading partners.
-
Enhance value addition of EAC export products.
Download: EAC Trade and Investment Report 2015 (PDF, 5.8 MB)
Related News


37th COMESA Intergovernmental Committee Meeting opens in Lusaka
The 37th meeting of the Common Market for Eastern and Southern Africa (COMESA) Intergovernmental Committee (IC) opened in Lusaka on 30 October 2017.
The IC brings together Permanent/Principal secretaries to discuss and review implementation of regional integration programmes and activities and making recommendations to the Council of Ministers for decision making.
Zambia’s Minister of Commerce, Trade and Industry Mrs Margaret Mwanakatwe, who officially opened the meeting said the implementation of regional commitments and full-scale participation of all member States in COMESA programmes requires improvement.
“The low level of transposition of regional instruments at Member States level has negatively affected the implementation of various programme,” she said. In this regard, there is need for Member States to implement agreed Summit Decisions.”
The meeting was informed on the progress made towards the realization of a full free trade area. Currently 16 out the 19 countries have joined the free trade area since it was launched in 2000. The Secretariat is providing technical assistance the remaining countries to join the COMESA FTA.
On infrastructure, COMESA is providing leadership in enhancing connectivity by taking a holistic corridor-based approach to infrastructure development and management. This is based on three pillars namely policy and regulatory harmonization, facilitation and development of priority regional physical infrastructure covering transport, information communications technologies and energy.
A report of the COMESA Ministers of Industry who met in September this year was presented to the IC for noting. The ministers adopted the industrial strategy for the region which focuses on energy, textiles and garments, agro-processing, leather and leather products, agro-chemicals and mineral beneficiation among others.
Minister Mwanakatwe appealed to member states to consider appropriate funding of the COMESA budget for us to sustain efforts made so far.
She said: “Over the years, the resource envelope has continued to shrink. This has resulted in some of COMESA’s flagship programmes being discontinued and more are likely to follow.”
She also appealed to the IC to recommend to the Council of Ministers the implementation of the approved organization structure of the Secretariat. This would greatly enable the smooth operationalization of work programmes.
COMESA programmes are guided by the Treaty, the Medium Term Strategic Plan and the decisions of the Council of Ministers and the Summit. These provide a roadmap for deepening the integration process through the consolidation of the FTA.
Other programmes include development of cross border economic infrastructure, development of agriculture and industry, enhancement of peace and security, mainstreaming of gender, climate change adaptation and mitigation, establishment of the Customs Union, the Common Market and the Monetary union among others.
Related News


Department of Trade and Industry to lead an Investment and Trade Initiative to the DRC
The aim of the ITI is to increase exports of the South Africa value-added goods to the DRC market
The Department of Trade and Industry (the dti) will lead a delegation of twenty-nine businesspeople to the Democratic Republic of Congo (DRC) for the 8th Investment and Trade Initiative (ITI) scheduled to take place in Kinshasa and Lubumbashi from 6-11 November 2017. The aim of the ITI is to increase exports of the South Africa value-added goods to the DRC market.
According to the Minister of Trade and Industry, Dr. Rob Davies, the objective of the ITI is also to increase bilateral trade and investment between South Africa and the DRC. He says the ITI will afford South African companies the opportunity to interface with their Congolese counterparts in an endeavour to forge partnerships and joint-ventures.
“South Africa and DRC have the potential to trade at an optimal level in different sectors of the economy especially beneficiation and manufacturing. There is still work that needs to be done in terms of further strengthening commercial and investment relations and focusing on new collaboration and trade partnerships in key areas of the economies of the markets, and we are optimistic that the ITI will provide that platform,” says Davies.
Sectors targeted for the ITI are agro-processing, built environment. mining capital equipment, energy, chemicals, pharmaceuticals and medical equipment. The programme for the ITI will include business seminars, roundtable discussions, site visits and business-to-business meetings.
Bilateral trade between South Africa and the DRC increased from R8 billion in 2011 to R12.7 billion in 2016.
Distributed by APO Group on behalf of The Department of Trade and Industry, South Africa.
Related News


tralac’s Daily News Selection
A reminder: The Doing Business 2018 report was released today. Read more here.
South Africa’s September trade statistics: another surplus (SARS)
The R4bn trade balance surplus for September 2017 is attributable to exports of R101.76bn and imports of R97.76bn. Exports decreased from August 2017 to September 2017 by R1.61bn (1.6%) and imports increased from August 2017 to September 2017 by R0.36bn (0.4%). Exports for the year-to-date (1 January to 30 September) grew by 5.4% from R818.59bn in 2016 to R862.61bn in 2017. Imports for the year-to-date of R815.49bn are 1.2% less than the imports recorded in January to September 2016 of R825.25bn, leaving a cumulative trade balance surplus of R47.12bn for 2017.
South Africa: Better trade terms will improve access to Asia for citrus exporters (Business Day)
Southern hemisphere countries such as Chile, Peru and Australia enjoy trade agreements with up to nine Asian countries – a grave illustration of SA’s problematic position. These countries enjoy partial and even free trade agreements, which are invaluable when it comes to maximising opportunities in a given market. They enjoy significant savings and are spared a lot of the bureaucracy that SA has to endure. The absence of required trade agreements – compounded by restrictive import tariffs – makes seamless exports to countries like China, Indonesia, Japan, South Korea, Philippines, Thailand and Vietnam much more difficult. But we need to up the ante on initiating and concluding trade negotiations that will make for ease of trade. The Citrus Growers’ Association’s relationship-building and maintenance efforts with Asian countries cannot replace robust collaboration and effective communication between governments and industry to increase market share in Asia. [The author, Justin Chadwick is CEO of the Citrus Growers’ Association of Southern Africa]
Olu Fasan: Africa needs a single market but lacks the will to create it (BusinessDay)
The CFTA is, of course,a laudable initiative, but, truth be told, it can’t, as currently envisaged, deliver the kind of regional integration that I have been discussing here. And, for me, there are three reasons for this. Extract: The aim of any serious regional trade agreement is tariff elimination and not tariff reduction. It is deep and comprehensive liberalisation. But the discussions in the CFTA negotiations are fixated on the modalities for designating sensitive products and exclusion lists. And, of course, the more exemptions, exclusions and sensitivities are reflected in the CFTA, the more it becomes a shallow FTA. It is not clear how far the agreement will go on services. What about intellectual property rights and competition rules?
3rd STC on Finance, Monetary Affairs, Economic Planning and Integration: update
For a Chinese company building Central Africa’s first auto plant it’s been a bumpy road (Quartz)
But the difficulties the manufacturer has had in setting up show the complications of doing business in Cameroon. Parts for the Star of Africa prototypes have already been made in China and are waiting the green light to be delivered to Kribi, Cameroon. Already manufactured parts of the car plant, made in China, are also awaiting delivery to Kribi. The company has yet to get access to 500 hectares of land offered by the government of Cameroon for building the plant. The company is also yet to reach a conclusion in negotiations with government over customs duties. Cameroon’s National Anti-Corruption Commission is investigating claims that government officials have delayed the plant over demands for shares in the company and kickbacks. Officials of the company say top ranking government officials have impeded the process. Yonguet said that Cameroon’s president Paul Biya, with whom Lu has personally met, has had to intervene.
The role of China in Africa’s industrialization: the challenge of building global value chains (Journal of Contemporary China)
The inherent asymmetries that flow from these dynamics highlight the extent to which resource extraction has developmental limits, and any dimension of external relations that is built on this shaky economic foundation is bound to subject the continent to external vicissitudes over which it has little political, policy and managerial control. Such a fraught scenario thus has the potential to undermine Africa’s long-term developmental prospects. One of the critical challenges for African countries – and this should be the basis for their engagement with external actors such as China – is managing structural change through industrial policies and value chain development in a manner that is salutary for beneficial and growth- and welfare-enhancing integration into the global economy.
The key argument of this article, therefore, is that there is a need to rethink the terms of Africa’s future growth and development not only in terms of industrialization – often conceived narrowly as manufacturing – since there are fewer possibilities for the continent to undertake industrial development along a trajectory similar to earlier industrializers. Rather, going forward a strategic trade and industrial policy perspective should be the thrust of China-Africa relations in order to take advantage of the calculus of opportunity that currently exists. Thinking in terms of value-addition and value chains broadens the sectoral focus to encompass aspects of manufacturing, services and innovation in agriculture. The authors do not suggest here that this should be brought to fruition through a big-bang approach. Instead the locus of Africa’s relationship with China should be a policy approach that aims to promote structural diversification. [The authors: Mzukisi Qobo, Garth le Pere]
China-Africa: High time for a common integrated African policy on China (IGD conference proceedings)
EAC places donor funds under tight control (Daily News)
EAC Secretary General Ambassador Liberat Mfumukeko told the first EAC Development Partners Consultative Forum that the secretariat has already recruited the manager for the Partnership Fund, with the view of enhancing fund management and efficiency. “The Partnership Fund is key in coordination of EAC development partner support. It has continuously played critical role in supporting activities to accelerate EAC agenda since its inception a decade ago,” Ambassador Mfumukeko said, hinting that the fund manager has already reported for work. Head of Corporate Communications and Public Affairs Department at the EAC Secretariat Owora Othieno said the new unit will deal with administration of the fund, communication with fund members, monitoring and evaluation of the achievements, budgeting, financial control, auditing and supervision of work-plan execution. [EAC pushing for secured medical drugs]
Hector R. Torres: An opportunity for the WTO (Project Syndicate)
One key problem that must be addressed relates to “special and differential treatment” (S&D). About two thirds of the WTO’s 164 members have declared themselves developing countries – a label that entitles them to S&D provisions, including the authority to maintain trade tariffs for a longer period of time. With the WTO lacking any benchmarks or indicators to determine when a country should be weaned off S&D, it is no surprise that no developing country has ever “developed.” To be sure, since S&D was first introduced in 1979, many developing countries have grown richer. But they have shown no indication that they are ready to relinquish the benefits of S&D, even for industries that have become internationally competitive. It is hard to argue that all developing countries should enjoy the indefinite privilege of opting out of the WTO’s general obligations for all sectors of their economies. And with so many of their WTO partners claiming preferential status, developed-country members often resist trade concessions within the organization, preferring to conduct negotiations in other forums. The dynamic in the WTO stands in stark contrast to that within the International Monetary Fund and the World Bank.
Roberto Azevêdo: Global trading system has constructive role to play to help drive inclusivity (WTO)
While the basis of this system was established 70 years ago, I think that its architecture - underpinned by principles such as transparency, predictability and non-discrimination - remain fundamental to the proper functioning of the global economy today. At a more fundamental level, we all saw the value of the trading system during the financial crisis. In the 1930s, protectionist measures wiped out two-thirds of trade flows – with devastating consequences. In the crisis of 2008 we did not see the same escalation – precisely because governments knew they were bound by common rules. They held each other to the agreed standards. And these agreed standards are quite clear. We know when red lines are crossed – which we did not see in the 1930s. Our monitoring shows that trade restrictions imposed by the G20 economies since the 2008 crisis cover just 4.25 percent of world trade. This shows that the system is doing what it was created to do. At the same time, I think that we can do more to ensure that the system is more inclusive, that it addresses the challenges of our times – while also upholding these essential principles. This is, ultimately, in the hands of members. And I think we have some good foundations to build on.
A court to fix all investor-state rows? (The Hindu)
Embroiled in 22 arbitration proceedings against it in disputes with prominent global investors, including Vodafone and Cairn Energy, India has cautiously welcomed a proposal to establish a ‘World Investment Court’. The World Court, a plan pushed mainly by the EU, is to be a “permanent, independent, legitimate, accountable, consistent and effective” global body framework with a mechanism for appeal as well, to resolve the current and future investor-State disputes including the ones that India is/could be involved in. The matter is coming up for discussion next month at the UN Commission on International Trade Law (Uncitral), of which India is a member along with 59 other nations representing ‘various geographic regions and the principal economic and legal systems of the world’. The Uncitral works on the ‘modernisation and harmonisation’ of international business rules. Responding to a questionnaire sent by an Uncitral Working Group mandated to look into issues including the proposed WIC, India said it “welcomes the move to have discussions and deliberations on the proposal, and further comments could be provided in due course.” However, it said, “The legal and practical challenges to establishing a WIC should not be underestimated.” It added, “one of the most critical areas in designing a permanent investment court relates to its composition, structure and certainty.”
Trade Policy Forum update: US pushes India on trade deficit, price caps on medical devices
Ibrahim Assane Mayaki: Banking on African infrastructure (Project Syndicate)
Yet, if the recent past is any guide, the capital needed will be difficult to secure. Between 2004 and 2013, African states closed just 158 financing deals for infrastructure or industrial projects, valued at $59 billion – just 5% of the total needed. Given this track record, how will Africa fund even a fraction of the World Bank’s projected requirements?
|
Today’s Quick Links: Facebook launches its first African Small Business Council in Nigeria Malawi lifts ban on maize exports Towards an IGAD strategy on HIV, TB and Malaria Uganda’s textile industry is picking up the threads Democratic Republic of Congo: UNSC press statement; UN warns of ‘looming humanitarian catastrophe’ in strife-torn Kasai region Intergovernmental Group of Experts on Financing for Development (8-10 November, Geneva). The background papers: Scaling up finance for the SDGs: experimenting with models of multilateral development banking (Ricardo Gottschalk, Daniel Poon, pdf), Blended finance for development (Javier Pereira, pdf) Steps to increase cooperation between national development banks, the private sector and multilateral banks London 2018 Illegal Wildlife Trade Conference: update Annual Bank Conference on Development Economics: call for papers on the theme Political Incentives and Development Outcomes |
Related News


Sub-Saharan African economies set new record in reforming their business climate: Doing Business
Sub-Saharan Africa economies adopted a record number of business reforms for a second consecutive year, says the 15th anniversary edition of the World Bank Group’s annual Doing Business report, which monitors the ease of doing business for small and medium enterprises around the world.
A total of 83 business reforms were carried out in the past year, surpassing the previous year’s record of 80 reforms. This brings to a total of 798 the number of reforms carried out in the past 15 years in the 48 economies of the region monitored by Doing Business 2018: Reforming to Create Jobs, released today.
The region is well represented in this year’s global top 10 improvers, based on reforms undertaken, with Malawi; Nigeria; and Zambia. Malawi, which implemented four reforms, made significant improvements in the area of Getting Credit by adopting a new law that sets clear rules related to bankruptcy procedures and by establishing a new credit bureau. Nigeria also improved access to credit by guaranteeing borrowers the right to inspect their credit data from the credit bureau and also made starting a business faster by allowing electronic stamping of registration documents. Reforms in Zambia also included the strengthening of access to credit by adopting a new Movable Property Act and by setting up a new collateral registry.
Much of the reform activity in the past year focused on the areas of Trading Across Borders and Starting a Business, with 15 reforms each, followed by Dealing with Construction Permits, where 14 reforms accounted for 64 percent of the 22 reforms recorded in this area globally. Zambia implemented a global automated system for customs data (ASYCUDA), making it easier for businesses to trade across borders, while Angola and Mozambique made trading across borders easier by improving port infrastructure.
Several economies, including Benin, Cabo Verde, the Democratic Republic of Congo, Gabon, Ghana, Niger, Nigeria and the Seychelles increased the transparency of dealing with construction permits by publishing regulations related to construction online. Angola also made dealing with construction permits easier and less time-consuming by improving its system for building permit applications.
Kenya implemented the most reforms in the region in the past year, with six. Among other improvements, Kenya made starting a business easier by reducing the number of procedures required to register a business, and reduced the time for import documentary compliance by utilizing a single window system. Kenya also improved the reliability of electricity supply by investing in distribution lines and transformers and by setting up a specialized squad to restore power when outages occur and implemented an online platform (itax) for filing and paying corporate income tax.
Four other economies – Mauritania, Nigeria, Rwanda and Senegal – implemented five reforms each during the past year. Rwanda, which is second only to New Zealand in Registering Property, implemented online services to further facilitate property transfers. As a result, it now takes only seven days to legally transfer a property title in Rwanda.
Notable reforms in Senegal included the introduction of stricter pre-trial hearing rules that led to a reduction of the time necessary to resolve a commercial dispute. These new rules have reduced the time to enforce a contract from 925 days to 740 days. Senegal also made starting a business and registering property less costly by reducing the notary fees for company incorporation and lowering the costs of transferring property, respectively.
Mauritius, the region’s top-ranked economy, carried out four reforms, which included outsourcing the design and construction of sewerage connection works, thus, speeding up the process of obtaining a construction permit and improving processes to facilitate cross border trade. Mauritius also made it easier to transfer property by reducing the transfer tax, implementing a complaint mechanism and publishing service standards.
In the ease of doing business global rankings, Mauritius is in 25th place, followed by Rwanda (41), and Kenya (80) as the region’s top ranked economies.
The Sub-Saharan Africa region continues to struggle in the area of Getting Electricity. On average, obtaining an electricity connection takes 115 days in the region, compared to the global average of 92 days.
“The reform effort in Sub-Saharan Africa is singularly worth celebrating, as the region is beset with myriad crises, including conflict and violence. We hope to continue recording the region’s successes in enabling entrepreneurship to address the challenge of job-creation, particularly for the region’s millions of young women and men,” said Rita Ramalho, Acting Director of the World Bank’s Global Indicators Group, which produces the report.
Highlights of the region’s economies’ successes over the past 15 years include:
-
Making it easier to register a business has been a major focus for the region in the 15 years since Doing Business was first published, with 163 reforms recorded in this area. In 2003, it took 61 days on average to start a business in the region. Today, it takes 24 days, which compare with the global average of 20 days. In Kenya, for example, the time needed to start a business has been more than halved from 60 days in 2003, to 25 days today.
-
In the area of Enforcing Contracts, Rwanda reduced the time to settle a commercial dispute from 395 days 15 years ago, to 230 days today. In Resolving Insolvency, Zambia increased the recovery rate from 17 cents on the dollar in 15 years ago, to 48 cents on the dollar today.
-
The biggest reformers in the region have been Rwanda, with 52 reforms in 15 years, followed by Kenya with 32 reforms and Mauritius with 31 reforms.
Trading across Borders
Doing Business records the time and cost associated with the logistical process of exporting and importing goods. Doing Business measures the time and cost (excluding tari s) associated with three sets of procedures – documentary compliance, border compliance and domestic transport – within the overall process of exporting or importing a shipment of goods. The most recent round of data collection for the project was completed in June 2017.
Where do the region’s economies stand today?
How easy it is for businesses in economies in Sub-Saharan Africa (SSA) to export and import goods? The global rankings of these economies on the ease of trading across borders suggest an answer. The average ranking of the region and comparator regions provide a useful benchmark.*
How economies in Sub-Saharan Africa (SSA) rank on the ease of trading across borders

* The top 10 ranked countries in the SSA region, along with South Africa, Nigeria and the regional average, are shown here.
Doing Business records nearly 3,200 reforms in 15 years to improve business climate worldwide
Governments in 119 economies carried out 264 business reforms in the past year to create jobs, attract investment and become more competitive, says the World Bank Group’s latest Doing Business 2018 report.
Marking its 15th anniversary, the report notes that 3,188 business reforms have been carried out since it began monitoring the ease of doing business for domestic small and medium enterprises around the world.
“Job creation is one of the transformational gains that countries and communities can achieve when the private sector is allowed to flourish. Fair, efficient and transparent rules, which Doing Business promotes, improve governance and tackle corruption,” said World Bank Chief Executive Officer Kristalina Georgieva.
Developing countries carried out 206 reforms, accounting for 78 percent of the total reforms, with Sub-Saharan Africa implementing 83 reforms, a record for a second consecutive year for the region, and South Asia implementing a record 20 reforms. A large number of reforms centered on improving access to credit and registering a new business, with 38 reforms each, as well as facilitating cross border trade, with 33 reforms.
In its annual ease of doing business rankings, New Zealand, Singapore and Denmark retained their first, second and third spots, respectively, followed by Republic of Korea; Hong Kong SAR, China; United States; United Kingdom; Norway; Georgia; and Sweden.
This year’s top 10 improvers, based on reforms undertaken, are Brunei Darussalam (for a second consecutive year); Thailand; Malawi; Kosovo; India; Uzbekistan; Zambia; Nigeria; Djibouti; and El Salvador. For the first time, the group of top 10 improvers includes economies of all income levels and sizes, with half being top improvers for the first time – El Salvador, India, Malawi, Nigeria, and Thailand.
“Public policy plays a decisive role in enabling small and medium businesses to start, operate and expand. Governments around the world are increasingly turning to Doing Business for objective data to underpin their actions. More importantly, the fact that Doing Business is transparent and publicly available means that citizens can hold governments accountable for reforms that benefit firms, households, and society at large,” said Shanta Devarajan, the World Bank’s Senior Director for Development Economics.
Since its inception, Doing Business has recorded business reforms in 186 of the 190 economies it now monitors. Rwanda has implemented the highest number of business reforms over the past 15 years, with a total of 52 reforms, followed by Georgia, which advanced this year into the top 10 ranked economies (47 reforms) and Kazakhstan and the Former Yugoslav Republic of Macedonia (41 reforms each).
Easing the requirements for Starting a Business has seen the largest number of reforms, with 626 reforms recorded in the past 15 years. As a result, the time needed to start a new small or medium business has more than halved to an average of 20 days worldwide, compared with 52 days in 2003. In addition, in 65 economies, entrepreneurs can complete at least one business incorporation procedure online, compared with only nine in 2003. Similar progress is also seen in other Doing Business areas.
“As we celebrate the 15th anniversary of Doing Business, it is particularly gratifying to see that many of the reforms are being carried out in economies and sectors where they are most needed. We look forward to continuing to shine a light on the real hurdles faced by entrepreneurs, both women and men, and celebrating policy change successes,” said Rita Ramalho, Acting Director of the World Bank’s Global Indicators Group, which produces the report.
The report also monitors hurdles faced specifically by women in the areas of Starting a Business, Registering Property and Enforcing Contracts. This year’s report records a welcome reform by the Democratic Republic of Congo, which eliminated the requirement for women to obtain their husband’s permission to register a business. However, 36 economies continue to place obstacles for women entrepreneurs, with 22 economies imposing additional steps for married women to start a business and 14 limiting women’s ability to own, use and transfer property.
This year’s report includes two case studies on transparency, which analyze data from business registries and land administrations and find that economies with more transparent and accessible information have lower levels of corruption and bribery. A third case study on private sector participation in formulating construction regulation finds that such rules exhibited higher costs and a propensity for conflicts of interest. A fourth case study highlights three successful insolvency reforms in France, Slovenia and Thailand, and lessons that are transferable to other economies.
By region, economies in East Asia and the Pacific implemented 45 reforms in the past year. The region is home to two of the world’s top 10 ranked economies, Singapore and Hong Kong SAR, China, and two of this year’s top 10 improvers, Brunei Darussalam and Thailand. In the past 15 years, the region has implemented 371 reforms. As a result, the time needed to start a new business has been more than halved to 24 days now, from 50 days in 2003.
The Europe and Central Asia region implemented 44 reforms during the past year. The region is host to a top ranked economy, with Georgia in ninth place, and two of this year’s top improvers, Kosovo and Uzbekistan. In the past 15 years, the region has been an active reformer, with 673 reforms implemented. It now takes 10.5 days to register a new business in the region, compared with 43 days in 2003.
A total of 26 reforms were carried out in the Latin America and the Caribbean region, with El Salvador earning a spot among this year’s top improvers for the first time. The region has implemented 398 reforms in the past 15 years. Now, starting a business in the region takes on average 38 days, compared to 78 days 15 years ago.
The economies of the Middle East and North Africa implemented 29 reforms in the past year. The region has implemented 292 reforms in the past 15 years. As a result, it takes 17 days on average to start a business in the region, compared to 43 days in 2003. However, the region lags on gender-related issues, with 14 economies imposing additional barriers for women entrepreneurs.
In South Asia, 20 reforms were implemented by six of the region’s eight economies. India carried out eight reforms, the highest number for the country in a single year. Over the past 15 years, the region has implemented 127 reforms. Fifteen years ago, it took over 50 days on average to start a business in the region, compared to 17 days now.
Reform activity continued to accelerate in Sub-Saharan Africa, with 36 economies implementing 83 business reforms in the past year. The region is home to three of this year’s top 10 improvers – Malawi, Nigeria, and Zambia. Over the past 15 years, the region has implemented 798 reforms. In 2003, it took 61 days on average to start a business in the region, compared to 22.5 days today.
The full report and its datasets are available at www.doingbusiness.org.
Related News


Growth, inequalities and employment in Africa in focus during 3rd STC on Finance, Monetary Affairs, Economic Planning and Integration
The Ministerial segment of the Third Specialized Technical Committee on Finance, Monetary Affairs, Economic Planning and Integration opened in Addis Ababa on 26 October 2017. The meeting was preceded by Expert Meetings from 23-25 October, 2017.
Following the postponement of the Joint Annual Meetings of the AU STC on Finance, Monetary Affairs, Economic Panning and Integration and the United Nations Economic Commission for Africa Conference of African Ministers of Finance, Planning and Economic Development that were scheduled to be held in Dakar, Senegal, from 23 to 28 March 2017, this 3rd AU STC was an opportunity for Member States to discuss on topics such as:
-
the Revised Strategy for the Harmonization of Statistics in Africa;
-
Assessment of progress on regional integration in Africa;
-
African Inclusive Markets Excellence Centre;
-
Agenda 2063; and
-
the Report of the F10 Ministers of Finance on the 0.2 percent levy on imports, among others.
This conference was held at a critical time for Africa, which is experiencing a series of economic, social, food, energy, climate and financial insecurities. However, it must be recognized that it currently has an economic potential. From 2005 to 2015 the African continent recorded on average and per year a growth rate of about 5%. But since 2016, this growth momentum has dropped to around 3%, partly due to the fall in the price of commodities, especially oil. The IMF forecasts a growth rate of around 2.49% for 2017.
In his opening remarks, the Commissioner for Economic Affairs of the African Union, H.E. Prof Victor Harison thanked all delegates in attendance and noted that the theme of the STC, “Growth, Inequalities and Employments” falls right in line with the African Union Theme of the Year “Harnessing Demographic Dividends through Investments in Youth” as Africa has a particularly young and dynamic demography, making it a land of opportunities for short and medium-term and above all long-term and profitable investments in agriculture and agribusiness, infrastructure and energy, tourism, habitat among other sectors.
He noted that “At the African Union Commission, we are convinced that taking full advantage of the demographic dividend requires a continental approach built on the foundation of regional integration. In this perspective, the development of regional and continental programs in the fields of education, infrastructure, energy, and others will catalyze our efforts to achieve more inclusive growth, driving the structural transformation of our continent.”
Commissioner Harison reiterated the Commission's willingness to work in close cooperation with its Member States to define and implement the policies necessary for sustainable development in Africa, that is, economically efficient, socially equitable and ecologically sustainable for development.
Meanwhile, a Ministerial panel discussion on the theme of the STC was held, followed by a review of the report and recommendations of the Experts meeting to close out the activities of the STC.
The Report of the outcomes of the STC will be submitted for consideration at the AU Assembly of Heads of State and Government in January 2018.
Related News


South Africa Merchandise Trade Statistics for September 2017
South Africa trade surplus well below expectations
South Africa’s trade surplus decreased to R4.00 billion in September of 2017 from an upwardly revised 5.98 billion surplus in August, and below market expectations of a R7.0 billion surplus.
Exports decreased 1.6 percent after an 11 percent jump in August while imports advanced at 0.4 percent. Considering the January to September period, exports increased 5.4 percent and imports decreased 1.2 percent, shifting the country’s trade balance into a R47.1 billion surplus from a R6.7 billion gap in the same period of 2016.
Compared with the previous month, exports decreased to R101.8 billion from R103.4 billion, led by a fall in shipments of base metals (-12 percent); vegetable products (-16 percent); chemical products (-15 percent) and precious metals and stones (-6 percent), while vehicles and transport equipment (14 percent) and mineral products (7 percent) rose. Major destinations for sales were China (9.9 percent); the US (8.2 percent); Germany (6.1 percent); India (6 percent) and Japan (4.9 percent).
Imports advanced to R97.8 billion from R97.4 billion, due to higher purchases of vegetable products (107 percent); mineral products (5 percent); chemical products (5 percent); prepared foodstuffs (11 percent) and animals and vegetable fats (47 percent). Imports came mostly from China (17.9 percent of total imports); Germany (11.8 percent); the US (6.7 percent); Saudi Arabia (4.7 percent) and India (4.2 percent).
Excluding trade with neighboring Botswana, Lesotho, Namibia and Swaziland, the country posted a trade deficit of R4.3 billion in September compared to a R1.9 billion gap in August.
The South African Revenue Service (SARS) today releases trade statistics for September 2017 recording a trade balance surplus of R4.00 billion. These statistics include trade data with Botswana, Lesotho, Namibia and Swaziland (BLNS).
The year-to-date (01 January to 30 September 2017) trade balance surplus of R47.12 billion is an improvement on the deficit for the comparable period in 2016 of R6.66 billion. Exports for the year-to-date grew by 5.4% whilst imports for the same period declined by 1.2%.
Including trade data with Botswana, Lesotho, Namibia and Swaziland (BLNS)
The R4.00 billion trade balance surplus for September 2017 is attributable to exports of R101.76 billion and imports of R97.76 billion. Exports decreased from August 2017 to September 2017 by R1.61 billion (1.6%) and imports increased from August 2017 to September 2017 by R0.36 billion (0.4%).
Exports for the year-to-date (01 January to 30 September 2017) grew by 5.4% from R818.59 billion in 2016 to R862.61 billion in 2017. Imports for the year-to-date of R815.49 billion are 1.2% less than the imports recorded in January to September 2016 of R825.25 billion, leaving a cumulative trade balance surplus of R47.12 billion for 2017.
On a year-on-year basis, the R4.00 billion trade balance surplus for September 2017 is a deterioration from the surplus recorded in September 2016 of R7.01 billion. Exports of R101.76 billion are 2.6% more than the exports recorded in September 2016 of R99.22 billion. Imports of R97.76 billion are 6.0% more than the imports recorded in September 2016 of R92.21 billion.
August 2017’s trade balance surplus was revised upwards by R0.04 billion from the previous month’s preliminary surplus of R5.94 billion to a revised surplus of R5.98 billion as a result of ongoing Vouchers of Correction (VOC’s).
Trade highlights by category
|
The main month-on-month export movements: R’ million |
||
|
Section: |
Including BLNS: |
|
|
Base Metals |
-R1 480 |
-12% |
|
Vegetable Products |
-R1 214 |
-16% |
|
Chemical Products |
-R1 030 |
-15% |
|
Precious Metals & Stones |
-R1 025 |
-6% |
|
Vehicles & Transport Equipment |
+R1 662 |
+14% |
|
Mineral Products |
+R1 700 |
+7% |
|
Total |
-R1 387 |
86% |
|
Total Movement |
-R1 612 |
100% |
|
The main month-on-month import movements: R’ million |
||
|
Section: |
Including BLNS: |
|
|
Vegetable Products |
+R1 782 |
+107% |
|
Mineral Products |
+R 717 |
+5% |
|
Chemical Products |
+R 544 |
+5% |
|
Prepared Foodstuff |
+R 374 |
+11% |
|
Animals/Vegetable Fats |
+R 301 |
+41% |
|
Precious Metals & Stones |
-R 229 |
-18% |
|
Textiles |
-R 384 |
-9% |
|
Vehicles & Transport Equipment |
-R755 |
-8% |
|
Machinery & Electronics |
-R979 |
-4% |
|
Original Equipment Components |
-R1 105 |
-12% |
|
Total |
+R 266 |
74% |
|
Total Movement |
+R 362 |
100% |
Trade highlights by world zone
The world zone results from August 2017 (revised) to September 2017 are given below.
Africa:
Trade Balance surplus: R16 283 million – this is a deterioration of R 559 million in comparison to the R16 841 million surplus recorded in August 2017.
America:
Trade Balance deficit: R 513 million – this is a deterioration of R 565 million in comparison to the R52 million surplus recorded in August 2017.
Asia:
Trade Balance deficit: R7 652 million – this is an improvement of R4 548 million in comparison to the R12 200 million deficit recorded in August 2017.
Europe:
Trade Balance deficit: R8 881 million – this is a deterioration of R3 262 million in comparison to the R5 619 million deficit recorded in August 2017.
Oceania:
Trade Balance deficit: R1 million – this is an improvement of R 62 million in comparison to the R 63 million deficit recorded in August 2017.
Excluding trade data with Botswana, Lesotho, Namibia and Swaziland (BLNS)
The trade data excluding BLNS for September 2017 recorded a trade balance deficit of R 4.31 billion. This is a result of exports of R90.11 billion and imports of R94.42 billion.
Exports decreased from August 2017 to September 2017 by R1.44 billion (1.6%) and imports increased from August 2017 to September 2017 by R1.01 billion (1.1%).
The cumulative deficit for 2017 is R21.69 billion compared to R85.99 billion deficit in 2016.
Trade highlights by category
|
The main month-on-month export movements: R’ million |
||
|
Section: |
Excluding BLNS: |
|
|
Vegetable Products |
-R1 169 |
-16% |
|
Precious Metals & Stones |
-R1 168 |
-7% |
|
Base Metals |
-R 1 478 |
-13% |
|
Chemical Products |
-R 989 |
-18% |
|
Vehicles & Transport Equipment |
+R1 703 |
+16% |
|
Mineral Products |
+R1 756 |
+8% |
|
Total |
- R1 392 |
94% |
|
Total Movement |
- R1 438 |
100% |
|
The main month-on-month import movements: R’ million |
||
|
Section: |
Excluding BLNS: |
|
|
Vegetable Products |
+R1 791 |
+111% |
|
Mineral Products |
+R 726 |
+5% |
|
Chemical Products |
+R 577 |
+6% |
|
Prepared Foodstuff |
+R 421 |
+14% |
|
Animals/Vegetable Fats |
+R 309 |
+42% |
|
Plastic & Rubber |
+R 164 |
+4% |
|
Precious Metals & Stones |
+R 156 |
+34% |
|
Textiles |
-R 430 |
-12% |
|
Vehicles & Transport Equipment |
-R 763 |
-8% |
|
Machinery & Electronics |
-R 951 |
-4% |
|
Original Equipment Components |
-R1 105 |
-12% |
|
Total |
+R 895 |
88% |
|
Total Movement |
+R1 014 |
100% |
Trade highlights by world zone
The world zone results for Africa excluding BLNS from August 2017 (Revised) to September 2017 are given below.
Africa:
Trade Balance surplus: R7 971 million – this is a deterioration of R1 037 million in comparison to the R9 007 million surplus recorded in August 2017.
Botswana, Lesotho, Namibia and Swaziland (Only)
Trade statistics with the BLNS for September 2017 recorded a trade balance surplus of R8.31 billion. This is as a result of exports of R11.65 billion and imports of R3.34 billion.
Exports decreased from August 2017 to September 2017 by R0.17 billion (1.5%) and imports decreased from August 2017 to September 2017 by R0.65 billion (16.3%).
The cumulative surplus for 2017 is R68.81 billion compared to R79.32 billion in 2016.
Trade Highlights by Category
|
The main month-on-month export movements: R’ million |
||
|
Section: |
BLNS: |
|
|
Machinery & Electronics |
-R 82 |
-5% |
|
Mineral Products |
-R 57 |
-3% |
|
Vegetable Products |
-R 45 |
-9% |
|
Chemical Products |
-R 42 |
-4% |
|
Vehicles & Transport Equipment |
-R 41 |
-4% |
|
Optical Photographic Products |
-R 26 |
-17% |
|
Precious Metals & Stones |
+R 142 |
+18% |
|
Total |
-R 150 |
86% |
|
Total Movement |
-R 174 |
100% |
|
The main month-on-month import movements: R’ million |
||
|
Section: |
BLNS: |
|
|
Precious Metals & Stones |
-R 385 |
-47% |
|
Live Animals |
-R 122 |
-23% |
|
Prepared Foodstuff |
-R 47 |
-10% |
|
Miscellaneous Manufactured Articles |
-R 45 |
-83% |
|
Textiles |
+R 46 |
+9% |
|
Total |
- R 553 |
85% |
|
Total Movement |
- R 652 |
100% |
Related News


Azevêdo: Global trading system has constructive role to play to help drive inclusivity
Speaking at a Trade Dialogues conference on “Technology, Globalisation and World Trade Governance” on 30 October, Director-General Roberto Azevêdo highlighted the important role the multilateral trading system can play to help maximise the opportunities presented by technology and to mitigate any adverse effects.
He said that new technologies are completely transforming the way in which goods, services and information are produced and exchanged so “we need to respond and adapt”. He added: “Working together, we can ensure that the global economic system is more inclusive, and that its benefits can reach everyone.” This is what he said:
Welcome to the WTO and to this Trade Dialogues event.
At the outset, let me thank the Graduate Institute and the Centre for Trade and Economic Integration for organizing this event today. Over the years our institutions have developed an important partnership. I am glad to strengthen this dialogue today.
We created the Trade Dialogues initiative at the WTO exactly for this purpose: to create a platform to interact with the wider trade community. We wanted to ensure that stakeholders could highlight issues they find important, enrich debates, and help spark conversations at the organization.
Academia, of course, is a very important interlocutor. As incubators of new ideas, you help bring different perspectives to the table. I think that this exchange is very important. It helps to ensure that research is relevant and that policy making is informed.
And I think that our discussion today is indeed very timely.
Today’s event looks at different future trends in trade – especially at the impact of new technologies in economies and societies. This is a topic at the forefront of many debates across the globe.
However, I also think that the timing of this event is also particularly fortunate. Today – the 30th of October – marks the 70th anniversary of the signing of the GATT, the WTO’s predecessor.
The GATT was created as one of the first multilateral trade instruments. When it was signed in 1947, it was considered to be the most far reaching negotiation ever undertaken in the history of world trade.
And while it has helped shape the multilateral trading system as we know it today, I think that when founders created the GATT, they could not have foreseen how much the world economy would change. Nor could they foresee how deep and challenging these changes would be.
For example, the multilateral trading system itself is much more diverse and inclusive.
The GATT had 23 founding members, accounting for around 70 percent of world trade. Today, the WTO has 164 members, in all stages of development, accounting for around 98 percent of world trade.
But also in comparison to 1947, another big structural change is happening. Automation, digitization and new business models are revolutionising the global economy.
New technologies are completely transforming the way in which goods, services and information are produced and exchanged.
Of course, this process is not new. Steam and the first machines powered the industrial revolution in the 19th century. Electricity, the assembly line and mass production enabled the large leap in living standards of the 20th century. And we progressively adapted to these changes, particularly in the job market.
But now in the 21st century, what is unprecedented is the pace and speed of these new technological developments.
Thanks to innovations like containerization to fibre optics, production stages happen in different countries.
In the 1980s, Toyota produced cars that were “Made in Japan”; today it produces cars that are “Made in the World”, with supplies and components coming from a score of different countries.
The internet has also had a huge impact on the way we trade.
Trade in services, data and information is surging across digital platforms. And we know that traditional trade in manufactured goods, agricultural products or natural resources is also increasingly enabled by digital technologies.
Between 2013 and 2015, the value of online trade jumped from 16 trillion to 22 trillion dollars – expanding the opportunities worldwide. This will continue to grow rapidly. It is estimated that e-commerce sales will rise by over 23 percent in 2017 alone.
All this presents many opportunities to leverage trade as a tool to promote growth and development. At the same time, this unprecedented technological advance is also driving big structural changes in labour markets.
Productivity gains from new technologies are reducing the demand for labour in more traditional sectors, such as agriculture or manufacturing.
In the year 1900, almost half of all workers in France were employed on farms. Today, the figure is less than 3 percent. In fact, in some economies 8 out of 10 job losses in manufacturing are due to higher productivity, not cheaper imports.
Of course, this so called “fourth industrial revolution” is not going to make all our jobs disappear. But it is bringing huge changes. And while these processes have brought progress overall, we need to recognise that not everybody has been able to benefit and participate.
We need to respond to this and adapt. This is a challenge facing governments and societies everywhere – in both developed and developing economies.
To help inform this conversation, we dedicated this year’s World Trade Report exactly to the topic of technology, trade and jobs. Earlier this year we also launched a joint report with the ILO that looks at the relationship between technology, trade and skills in today’s economy.
Those reports have generated some interesting debates. And it was clear from those conversations that sustainable and balanced economic progress will hinge on the ability of economies to adjust to changes and promote greater inclusiveness.
And while there may not be a ‘one size fits all’ recipe to deal with these challenges, some policies can play an important role here. They include, for example:
-
more active labour market policies,
-
the provision of support for workers, and
-
education policies to equip people with the right skills to participate in an information-driven global economy.
A great deal of these efforts will have to happen at the domestic level. And I also think that the multilateral trading system has a constructive role to play to help drive inclusivity.
While the basis of this system was established 70 years ago, I think that its architecture – underpinned by principles such as transparency, predictability and non-discrimination – remain fundamental to the proper functioning of the global economy today.
At a more fundamental level, we all saw the value of the trading system during the financial crisis. In the 1930s, protectionist measures wiped out two-thirds of trade flows – with devastating consequences.
In the crisis of 2008 we did not see the same escalation – precisely because governments knew they were bound by common rules. They held each other to the agreed standards. And these agreed standards are quite clear. We know when red lines are crossed – which we did not see in the 1930s.
Our monitoring shows that trade restrictions imposed by the G20 economies since the 2008 crisis cover just 4.25 percent of world trade. This shows that the system is doing what it was created to do.
At the same time, I think that we can do more to ensure that the system is more inclusive, that it addresses the challenges of our times – while also upholding these essential principles.
This is, ultimately, in the hands of members. And I think we have some good foundations to build on.
Recent WTO achievements at the WTO’s Ministerial Conferences in Bali and Nairobi show that members can deliver meaningful outcomes to support growth, development, inclusiveness and job creation.
Our next Ministerial Conference is in Buenos Aires this coming December, and it can be another opportunity for progress.
Conversations are ongoing on a number of fronts. I hope that we will leave Buenos Aires with members committed to strengthening the trading system, and with a clear path forward for our future work.
The global trading system has been – and will remain – a work in progress. We have come a long way in recent years – and now we must go further.
Especially at a time of fast economic change, we need to ensure that the multilateral trading system can help maximise the opportunities presented by technology, and help mitigate any adverse effect.
Working together, we can ensure that the global economic system is more inclusive, and that its benefits can reach everyone.
I wish you a successful event and look forward to hearing from your discussions.
Thank you.
Related News


China-Africa: high time for a common integrated African policy on China
The Institute for Global Dialogue, in partnership with the Friedrich Ebert Stiftung and the Wits Africa-China Reporting Project (ACRP) held a one-day symposium at the University of the Witwatersrand on 20th July 2017, on the theme China-Africa: high time for a common integrated African policy on China.
The symposium drew on South Africa’s hosting of the Johannesburg Summit and 6th Ministerial Conference of the Forum on China-Africa Cooperation (FOCAC) in December 2015.
The event marked the 15th year since the initiation of the FOCAC mechanism in 2000 and nearly a decade since the Beijing Summit of 2006. The 2nd FOCAC Summit adopted two outcome documents, namely the Johannesburg Declaration and the Johannesburg Action Plan (2016-2018), laying out comprehensive plans for China-Africa relations and practical cooperation for the next three years through a range of new ideas and policies.
As current co-chair of the Forum, South Africa is uniquely positioned to guide the consolidation of the African agenda in China-Africa engagements, including the realisation of greater synergy between the outcomes of Johannesburg and Africa’s Agenda 2063.
In line with increasing calls for a unified African policy and strategy, this symposium presented a platform to critically examine the prospects of a Pan-African policy and strategy to guide Africa’s engagement with China, in addition to taking stock of the implementation of the Johannesburg Action Plan.
This proceedings report presents a synthesis of the discussions at the seminar and summarizes key policy recommendations and implications.
Closing Remarks
Africa does not have a China policy; moreover, several African countries do not have their own declared foreign policies, which are available to the public, Mr. Barry van Wyk, Project Coordinator, ACRP, said.
The symposium was able to make progress in developing African positions towards China but not in terms of an overall African policy towards China. It may be noted that one of the biggest challenges to Africa is to act in a strategic manner, as a region and continent. Mr. van Wyk further asked if it is possible for Africa to be expected to speak with one voice and to integrate more closely. Furthermore, if Africa had a common position, would particular actors or individuals lead such an integration of African policy; and whether or not the private sectors of China and African countries could be mobilised.
It may be possible to address these questions by attempting to formulate common African positions on specific issues of common interest, and then to build from there. It is important to start with what African states agree on. What might emerge from this discussion is not necessarily a common African policy but a common African framework that utilises a multi-pronged approach. For this to be achieved, various African networks like this one here today can be integrated and operationalised to feed into a common African framework. This framework may include specific issues of common interest, such as environmental issues and industrialisation, which may highlight that African agency can take a unified position.
The onus is on Africa to get its house in order and to develop concrete plans towards engagement with China. In addition, it is essential to make use of empirical knowledge, which informs the Africa-China relationship and allows stakeholders to make constructive decisions. As part of this effort, Africans should enquire into what such an African policy would look like, and how to best embody African agency by means of a coherent road map, particularly because much of the current discourse, taxonomy and paradigms are based on colonialism. Africa must base its deliberations on a thorough understanding of China and Chinese culture so it can then approach China in a more prepared manner. Africa has various structures in place to engage with China, notably FOCAC.
However, it is becoming vital for Africa to question whether or not it must look beyond FOCAC and OBOR, and if these institutions that can facilitate African agency appropriately. In carrying the agenda forward, it was emphasized that the networks that are formed around the symposium would continue practically via working groups to develop a coherent document and involve more stakeholders, thus aiming to make a decisive impact on developing an African framework towards China by the next FOCAC meeting in 2018.
Download the Proceedings Report: China-Africa: High time for a common integrated African policy on China (PDF)
Related News


tralac’s Daily News Selection
Doing Business 2018 launches tomorrow. Selected previews:
(i) Ilyas M. Dawaleh (Djibouti’s Minister of Economy and Finance): We, govt of Djibouti, did great jobs in recent years. Some reforms implanted successfully, others are under process. Hope we’ll get good scores!! (ii) On India’s prospects: India to leapfrog 30 places in business ease rank; Sunil Mittal: Ease of doing business remains a major concern; Ease of doing business: what foreign investors really want?
Regional Economic Outlook for sub-Saharan Africa: fiscal adjustment and economic diversification (IMF)
The broad-based slowdown in sub-Saharan Africa is easing, and growth is expected to pick up to 2.6% in 2017 from last year’s 1.4%, the IMF said in its latest Regional Economic Outlook for sub-Saharan Africa. A recovery in oil production and a good harvest in Nigeria, as well as the easing of tensions in the Niger Delta accounts for more than half of the additional growth. The policy environment has started to improve. Fiscal deficits are stabilizing and current account deficits are narrowing, partly reflecting a slight rebound in commodity prices. The global environment has also been supportive, with strengthening growth momentum in the largest economies, commodity prices off their troughs, and improved access for sub-Saharan African economies to international capital markets. [Related: World Bank: Commodity prices likely to rise further in 2018; SARB’s Daniel Mminele: The performance of and outlook for the South African economy]
The Sub-Saharan African services economy: insights and trends (USITC)
The report begins with a brief overview of SSA services output, employment, and trade. This section also discusses a number of issues affecting the SSA services sector as a whole, including the growth in Chinese investment and foreign aid in the region, informal sector participation in the SSA services economy, and the extent of measures affecting the foreign provision of services in SSA. The second section of the report focuses on trends in particular services industries, and includes discussions on SSA markets for architecture, engineering, and construction services; financial services (with a focus on micro-insurance); telecommunications (with special attention to the recent expansion of submarine cable infrastructure and mobile money); tourism; and transportation services (with a particular emphasis on transit corridors). The final section of the report provides overviews of service sector developments in a sub-group of SSA countries, including Botswana, Ethiopia, Ghana, Kenya, Mauritius, Nigeria, Rwanda, Senegal, South Africa, Tanzania, Togo, Uganda, and Zambia. [Executive briefing version, pdf]
Can India double its services exports in five years? (The Wire)
Valued at $160bn plus, in 2016-17, India’s services sector’s contribution of 3.35% to the world services export is twice that of its merchandise exports, which is only 1.65% of the world’s merchandise exports. With increasing demand for Indian services worldwide and sustained support from the government, services exports have the potential to reach $300bn by 2022. Meeting this target will require taking the following steps. [The authors: Pradeep S Mehta, Sanjay Kumar Mangla]
The economic impact of geospatial services (IT News Africa)
Google has launched a report, conducted by research group AlphaBeta, detailing the impact of digital geospatial services on the South African economy (and others). Digital mapping services provide South African consumers with R50bn in annual benefits. South Africans users also save around 100-million hours per year from more efficient purchases through information on digital maps. This value of time saved amounts to R5bn based on local wage rates. Businesses have also benefitted from digital mapping services. According to the report (pdf), digital maps have supported around R456bn in sales for South African businesses by providing useful facts such as store hours, contact information and reviews.
Rwanda: Science, technology and innovation policy review (UNCTAD)
Rwanda has emerged over the past decade as one of Africa’s more innovative economies, a new UNCTAD report says (pdf). But the small, landlocked, mountainous country must bolster the use of technology in sectors beyond information and communication to sustain its remarkable 7.8% annual growth. Moving forward, the report recommends that Kigali ensure industrial policy and innovation needs “become the cornerstone of a national system of innovation”. “The rational is that much, if not all, of the top-level STI concerns will perfectly map from an industry sector innovation system to the national one,” the report says.
Space technology and Africa’s development: the strategic role of small satellites (Harvard Kennedy School)
This paper examines small satellite programs as windows of opportunity for countries to achieve their development goals. First, it locates the potential socioeconomic benefits of satellites in low-income countries. Next, it explores the recent history of, and lessons learned by, South Africa, Brazil, and South Korea. While tens of other countries have developed satellite programs, these case studies offer insights into how and why countries have created successful programs. Next, this chapter examines the latest technologies and focuses on emerging opportunities for current and future space programs. Lastly, it develops concrete options and a clear strategy for policymakers in emerging markets to consider when designing future programs. [The authors: Calestous Juma, Wesley L. Harris, Peter B. Waswa]
Making Nigeria GIs global: consultation update
Selected emerging themes and thoughts on GIs: (i) In order to achieve the objectives of GIs for Nigeria, there must be investments in data management and new technologies; (ii) Nigeria needs to develop a strong power of origin in order to establish its products as GIs in the global market; (iii) Standardisations of products to meet global standards, access to international trade opportunities as well as multilateral and bilateral agreements are pivotal towards achieving Nigeria GIs products. Profiled key resolutions: (i) The outcomes of the stakeholder engagement event strategically pave the way for a national summit in 2018 as well as to commence the process for a 10 years framework on enlisting products of Nigerian origin as global GIs; (ii) The commencement of national research on Nigeria GIs, whose report has to be made during the National Summit in 2018.
Kenya: E-Promis will enable government to gauge mega projects (The Standard)
The system, dubbed E-Promis, will now enable the Government to gauge whether capital-intensive projects are of any monetary value to the country or not. The Director of the Monetary and Evaluation Department at the Ministry of Statistics and Planning Samson Machuka said the new system would save taxpayers billions of shillings. “Previously, the Monitoring and Evaluation Department never appraised major mega projects, including the Thika Superhighway and the Standard Gauge Railway owing to turf wars, inadequate personnel and low funding, but with this new system that evaluates if the cost of the project is in tandem with the returns from that project, then we could be heading in the right direction,” said Dr Machuka in an interview.
Kenya: Mitumba imports up 8.2% in H2 to Sh6.6bn (Business Daily)
The data from the Kenya National Bureau of Statistics shows the import bill for second-hand clothes, also called ‘mitumba’, grew 8.2% from the Sh6.1 billion spent in the first half of last year. Kenyans prefer mitumba owing to high quality, design, and fair pricing which has seen imports stay on an upward trajectory, impacting negatively on cotton industry. The data shows volumes grew 12.4% to 69,862 tonnes from the 62,158 tonnes imported at a similar period last year. Mitumba imports have grown rapidly in the last two decades, leading to the decline of Kenya’s cotton industry. Kenya textile exports dropped 30% to Sh1.8 billion in the first half of 2017 compared to the Sh2.6 billion registered at a similar period last year. [Charities, resellers feeling the pinch of stiffer tariffs on cheap second-hand clothing flooding East Africa; Calvin Klein signs Kenyan EPZ firm to make underwear]
Namibia: SACU revenue to decline (The Namibian)
The recently announced South African medium term budget reveals that there will be a downward revision in the SACU revenue pool, which might see Namibia’s receipts decline by N$5,7 billion over the next three years. This was confirmed to The Namibian by Cirrus Capital’s Rowland Brown, who said the custom’s pool will experience a decline in revenue of 8% in the 2017/18, 10% in 2018/19 and 11,5% in 2019/20 financial years. “Namibia’s proportional share reduction would thus be around N$5,7 billion split over three years. This, however, may be revised, and Namibia may receive more than her proportional share based on the Sacu revenue sharing formula,” Brown said.
Egypt: Reaching out to Mercosur (Ahram)
The entry of the Egypt-Mercosur trade agreement into force this week is a further opportunity to boost the country’s foreign trade. The trade agreement signed between Egypt and the members of the South American Common Market members of Argentina, Brazil, Uruguay and Paraguay in 2010 was not implemented because it was not approved by Argentina until July 2017. However, the Egypt-Mercosur agreement came into effect after Argentina’s ratification had been formally sent to Mercosur. Minister of Industry and Foreign Trade Tarek Kabil said that the deal’s entry into force would help raise the volume of trade and investment between Egypt and the Mercosur countries, which stood at $3bn in 2016, according to figures from the Ministry of Industry and Foreign Trade. It is expected that the agreement will double that figure within 10 years.
Green industrialisation and entrepreneurship in Africa (New Climate Economy)
This paper discusses the opportunities – and challenges – for African policymakers and businesses on these three related issues: economic transformation, green growth, and entrepreneurship. Extract (pdf): The energy path that African countries take in the coming decades is not set in stone. Figure ES1 indicates that countries at the same per capita income often have very different energy use levels. One important factor will be the type of structural change going forward. A pattern of structural change dominated by heavy industry and manufacturing on the model of China and some other East Asian industrialising economies would tend, other things being equal, to be more energy and pollution intensive than structural change with a more balanced emphasis on high value added, internationally traded services and other sectors, in addition to more manufacturing. Mauritius, for example, consumes 70% less energy per unit of GDP today than Korea did in 1996, when it was at the same level of per capita income as Mauritius today. This difference is linked not only to global improvements in energy efficiency since 1996, but also to the greater importance of the service sector in Mauritius today than in Korea at that time. The pattern of urbanisation will also matter: [The authors: Milan Brahmbhatt, Catlyne Haddaoui, John Page]
Rick Rowden: Why India’s foreign investments in Africa’s hydrocarbons are not a good bet (EPW)
India has stepped up trade and investment in hydrocarbons in Africa, with nearly 17% of its total crude oil imports coming from Africa by 2016. This petroleum-related foreign direct investment and trade can be mutually beneficial in the short term, providing African exporters with a foreign market and helping India meet its energy needs. Such deals may become less effective economically over the medium and long term, however, given the increasing availability and cost-competitiveness of renewable energies, an array of restrictions and taxes on carbon emissions, and diminishing returns in the ratio of energy production to energy output.
|
Today’s Quick Links: Nobel Laureates Joseph Stiglitz, Michael Spence to co-chair independent commission on global economy The Global Commission on the Future of Work: first meeting update Priti Patnaik: Why has the US launched an offensive against the WTO’s dispute settlement system? Global Trade Review: The application of big data to agribusiness in Africa could be transformational in unlocking access to financing UNECA’s trade facilitation in Southern Africa consultation: infrastructure deficit remains a major challenge SA retailer Shoprite mulls Kenya entry Diaspora remittances overtakes tea, coffee, tourism as Kenya’s highest foreign exchange earner How Kenya’s political crisis affects East and Central Africa trading block Mauritius-Seychelles: bilateral meeting on economic, trade cooperation SEIFSA stressed by US investigations into carbon and alloy steel imports |
Related News

Sub-Saharan Africa: The path to recovery
The broad-based slowdown in sub-Saharan Africa is easing, and growth is expected to pick up to 2.6 percent in 2017 from last year's 1.4 percent, the IMF said in its latest Regional Economic Outlook for sub-Saharan Africa.
A recovery in oil production and a good harvest in Nigeria, as well as the easing of tensions in the Niger Delta accounts for more than half of the additional growth.
The policy environment has started to improve. Fiscal deficits are stabilizing and current account deficits are narrowing, partly reflecting a slight rebound in commodity prices. The global environment has also been supportive, with strengthening growth momentum in the largest economies, commodity prices off their troughs, and improved access for sub-Saharan African economies to international capital markets.
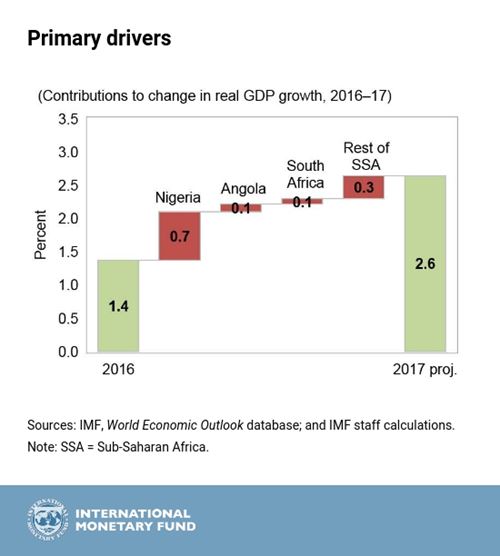
But while a third of sub-Saharan African countries continue to grow at about 5 percent, income per capita will barely increase in the region. Moreover, in 12 of the 45 sub-Saharan African countries, home to about 40 percent of the region’s population, or 400 million people, per capita incomes are expected to decline.
Beyond 2017, growth is expected at about 3½ percent, below the 5 percent mark achieved in the first half of the decade.
Mounting vulnerabilities
Vulnerabilities have increased in the region, notably, due to rising public debt, financial sector strains and low external buffers. Public debt is high not only in oil exporting countries but in many fast-growing economies as well. At the end of 2016, public debt exceeded 50 percent of GDP in nearly half of the sub-Saharan African countries. Debt servicing costs are also becoming a burden, especially in oil-producing countries. In Angola, Gabon, and Nigeria they absorb more than 60 percent of government revenues.
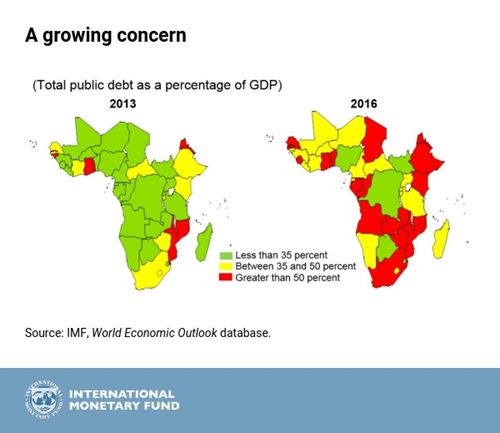
Driving this increase in debt is a combination of large fiscal deficits, a slowdown in growth, and in some countries, exchange rate depreciations. Increasingly, deficits are being financed by domestic banks and ultimately constraining the availability of credit to the private sector. In many countries, banks’ liquidity and solvency indicators have deteriorated, and non-performing loans have increased. Despite some narrowing in current account deficits, international reserves are now below adequacy levels in many countries, especially those with fixed exchange rate regimes.

These vulnerabilities are being compounded by political uncertainty resulting in a lack of clarity about future direction of economic policy, notably, in some of the region’s largest economies such as Nigeria or South Africa. This is weighing on consumer and investor confidence.
In this context, addressing fiscal vulnerabilities and unlocking constraints to growth emerge as the key economic policy priorities for the region.
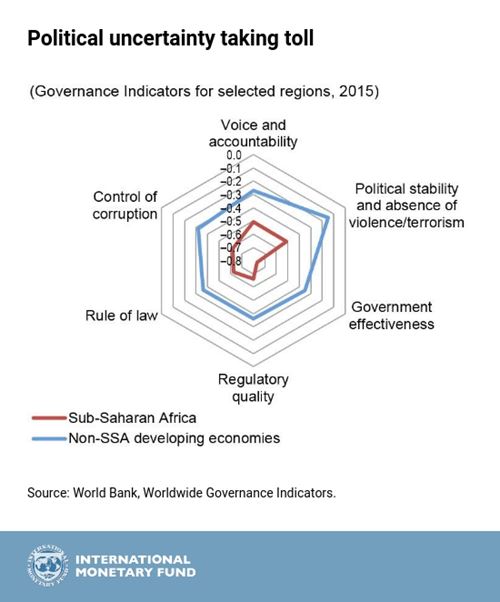
Addressing fiscal vulnerabilities
Most sub-Saharan African countries are planning fiscal adjustments to contain the recent increase in debt. But with the growth momentum weak, it is important that wherever possible fiscal adjustment is undertaken in a manner that limits the adverse effect on growth, while preserving fiscal space for priority spending.
While fiscal consolidation is most pressing in oil-exporting countries, other countries can use this opportunity to focus on raising revenues and making room for outlays on health and education, and other spending that have positive social impact and long-term growth effects.
However, the report says any further postponement of fiscal adjustments will likely increase public debt above sustainable levels given the recent pace of debt accumulation.
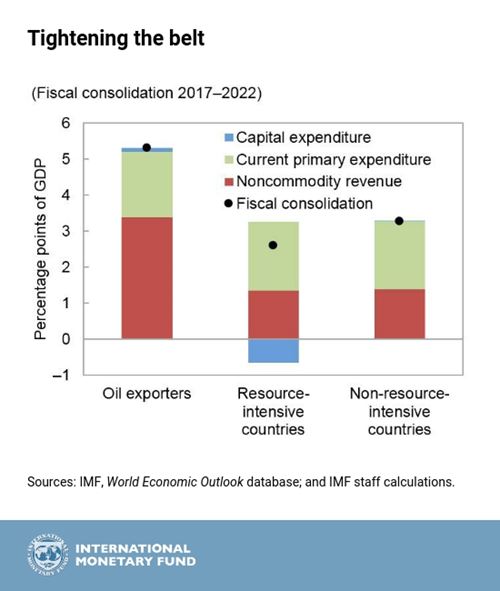
Boosting growth and diversification
The need to address infrastructure deficits – even in an environment of limited fiscal space – through well planned efficient investments is clear, but it is also critical to make progress on complementary reforms such as improving governance, including the areas of rule of law and government effectiveness, in which the region lags behind other developing countries.
Economic diversification has been an important driver of growth for many low-income countries. And while aggregate sub-Saharan Africa has made little progress in this regard, with increased concentration in the oil-based economies in the last few decades, several non-resource based economies, such as Burkina Faso, Rwanda, and Uganda have made significant progress in diversification. Country strategies to promote economic diversification should build on a country’s existing strengths and work best if they are tailored to tackle specific challenges. The report suggests sectoral policies will also likely be more successful if supported by efforts to enhance macroeconomic stability, improve education outcomes, bolster governance and transparency in regulation, and deepen financial markets.
Related News


Infrastructure deficit remains a major challenge to trade facilitation
Speaking at the official opening of the 23rd Session of the Intergovernmental Committee of Experts under the theme “Trade Facilitation in Southern Africa: Bridging the Infrastructure Gap”, Deputy Executive Secretary of the Economic Commission for Africa (ECA), Giovanie Biha, said that infrastructure deficit remains a major challenge to trade facilitation, intra-regional trade and economic development and transformation in Africa.
She observed that regional approaches and strategic partnerships to address problems of trade facilitation are increasingly being recognized since international trade involves the use of infrastructure and services of at least two countries.
“A regional approach is an efficient means of coordinating actions, setting priorities, reviewing progress, mobilizing resources, allocating funds, and monitoring contribution levels, with regard to solving common problems,” she said.
She said that the financial cost of meeting Africa’s infrastructure needs is quite huge and that according to the African Development Bank, it is estimated that Africa needs about USD $93 billion annually until 2020 to close the infrastructure gap.
“Africa must look inwards in financing its infrastructure development and dismantling obstacles to intra-Africa trade and the movement of persons across the continent,” she said.
Ms Biha noted the strides that the RECs are making in easing border pressures and promoting intra-Africa trade. Ms Biha cited the Chirundu One-Stop Border Post between Zambia and Zimbabwe as an excellent example of what the region can achieve with strong political will.
Ms Biha said that ECA, in collaboration with other development partners, offers to deepen its collaboration with countries in Southern Africa and stands ready to provide technical and advisory support to help tackle the trade facilitation challenges faced by the region.
Meanwhile, the Government of Zimbabwe says that investing in infrastructure requires both public and private sector effort through various strategies including (PPPs). Minister of Finance and Economic Development Dr Ignatius Chombo said that collaboration among adjoining States in resource mobilization and project implementation is crucial.
On the soft infrastructure front, Dr Chombo said that the Government of Zimbabwe has embarked on a 100 day Rapid Results Approach to Ease the Doing Business Environment through removal of impediments to investment and trade.
Speaking at the same meeting, Minister of State for Bulawayo Metropolitan Provincial Affairs Minister, Eunice Sandi-Moyo, said that more investment is required in the repair and modernization of the existing road, rail and air transports system; developing other physical and non-physical infrastructure; and in re-capitalization of the semi-dormant industrial sector.
The delegates and participants will review and adopt the recommendations of the Ad-hoc Expert Group Meeting on “Deepening Regional Integration in Southern Africa: The role, prospects and Progress on the Tripartite Free Trade Area” and also address the theme of the ICE meeting, namely, “Trade Facilitation in Southern Africa: Bridging the Infrastructure Gap” and come up with appropriate recommendations for different stakeholders especially member-states and the RECs in fast-tracking trade related infrastructure development in Southern Africa.
Related News


Commodity prices likely to rise further in 2018: World Bank
Oil prices to average $56 a barrel in 2018, up from 2017 average of $53/bbl
Oil prices are forecast to rise to $56 a barrel in 2018 from $53 this year as a result of steadily growing demand, agreed production cuts among oil exporters and stabilizing U.S. shale oil production, while the surge in metals prices is expected to level off next year, the World Bank said on Thursday.
Prices for energy commodities – which include oil, natural gas, and coal – are forecast to climb 4 percent in 2018 after a 28 percent leap this year, the World Bank said in its October Commodity Markets Outlook. The metals index is expected to stabilize in the coming year, after a 22 percent jump this year as a correction in iron ore prices is offset by increased prices in other base metals. Prices for agricultural commodities, including food commodities and raw materials, are anticipated to recede modestly in 2017 and edge up next year.
“Energy prices are recovering in response to steady demand and falling stocks, but much depends on whether oil producers seek to extend production cuts,” said John Baffes, Senior Economist and lead author of the Commodity Markets Outlook. “Developments in China will play an important role in the price trajectory for metals.”
The oil price forecast is a small downward revision from the April outlook and is subject to risks. Supplies from producers such as Libya, Nigeria, and Venezuela could be volatile. Members of the Organization of the Petroleum Exporting Countries (OPEC) and other producers could agree to cut production further, maintaining upward pressure on prices.
However, failure to renew the agreement could drive prices down, as could increased production from the U.S. shale oil industry. Natural gas prices are expected to rise 3 percent in 2018, while coal prices are seen retreating following a climb of nearly 30 percent in 2017. China’s environmental policies are anticipated to be a key factor determining future trends in coal markets.
Iron ore prices are forecast to tumble 10 percent in the coming year but tight supply should push up prices for base metals including lead, nickel and zinc. Downside risks to the forecast include slower-than-anticipated demand from China, or an easing of production restrictions on China’s heavy industries.
Gold prices are anticipated to ease next year on expectations of higher U.S. interest rates.
Agriculture prices are expected to edge up in 2018 due to reduced supplies, with grain and oils and meals prices rising marginally. Agricultural commodities markets are well-supplied and the stocks-to-use ratios (a measure of how well supplied markets are) of some grains are forecast to be at multi-year highs.
However, favorable weather patterns, well-supplied global food markets, and relatively low world prices do not necessarily imply ample food availability everywhere. Drought conditions that are by some accounts the worst in 60 years, have caused crops failures in parts of Ethiopia, Somalia and Kenya and led to severe food shortages. Conflicts in South Sudan, Yemen and Nigeria have driven millions of people from their homes and left millions more in need of emergency food.
The World Bank’s Commodity Markets Outlook provides detailed market analysis for major commodity groups, including energy, metals, agriculture, precious metals, and fertilizers. The report includes price forecasts to 2030 for more than 45 commodities. It also provides historical price data and supply, demand, and trade balances for most commodities.
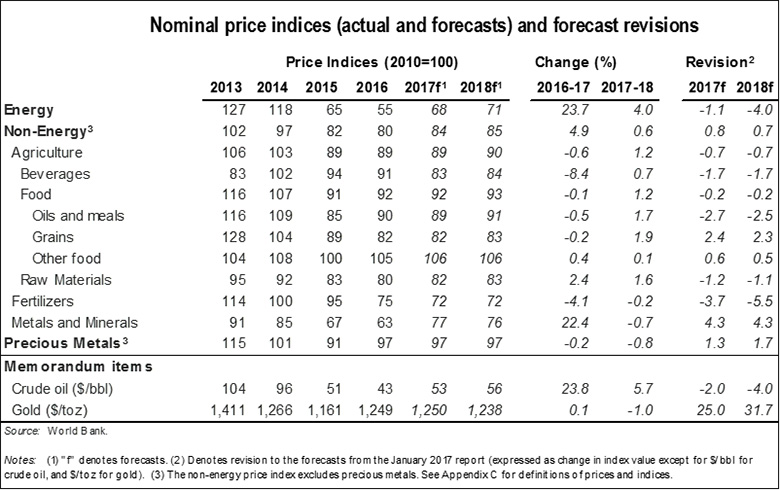
Related News


Increased innovation key to Rwanda’s continued success
UNCTAD presented in Kigali its review of the country’s progress in building a knowledge-based economy
Rwanda has emerged over the past decade as one of Africa’s more innovative economies, a new UNCTAD report says. But the small, landlocked, mountainous country must bolster the use of technology in sectors beyond information and communication to sustain its remarkable 7.8% annual growth.
UNCTAD’s Science, Technology and Innovation Policy Review of Rwanda, presented on Thursday in Kigali, says the country’s focus on information and communications technologies (ICTs) has helped the sector grow more than tenfold since 2000.
Internet users throughout the country can now surf on a fibre-optic network. And mobile coverage has reached almost 100%, with three providers offering 4G LTE8 broadband services.
While this is an indisputable policy choice, the report says, “A broader consideration of the nature of the technological progress of Rwanda is needed.”
“Rwanda’s innovation efforts in promoting high-tech sectors, such as ICTs and life sciences, are commendable. However, their outcomes will only be sustainable if improvements are made to innovation performance in the more mundane but essential activities that form the economic backbone of industry and agriculture,” the report says.
Vision 2020, which lays out the government’s development strategy, has its eyes set on a restructured economy, where industry and services account for more than three-fourths of gross domestic product (GDP).
This is because Rwanda needs to create around 200,000 off-farm jobs every year to employ new job seekers from rural areas, where 80% of the population still lives.
Although Industrial output grew by an average 9% between 2006 and 2015, this has not been enough to restructure the economy, the report says, as agriculture loses less than 1% of its share of GDP each year.
“Rwanda’s development goal is to become a middle-income nation. The change in relative size of industry and its contribution to economic growth can be an indicator of the strength of economic transformation processes,” the report says.
Currently, industry – manufacturing, construction, mining, water – accounts for about 15% of GDP (the share for services is 48%).
Moving forward, the report recommends that Kigali ensure industrial policy and innovation needs “become the cornerstone of a national system of innovation”.
“The rational is that much, if not all, of the top-level STI concerns will perfectly map from an industry sector innovation system to the national one,” the report says.
The Science, Technology and Innovation Policy Review of Rwanda was funded by the German Federal Ministry for Economic Cooperation and Development, with the German Corporation for International Cooperation acting in an advisory role.
STI Policy Reviews are a cornerstone of UNCTAD’s work to help developing countries compete better in a knowledge-based economy. Since 2008, UNCTAD has completed 11 reviews.
Related News
The sub-Saharan African services economy: Insights and trends
While sub-Saharan Africa (SSA) accounts for a small share (1.8%) of global commercial services trade volume, SSA services trade volume has grown rapidly in recent years, accounting for 18% of total SSA trade in 2014. U.S. services trade with the African continent has also grown rapidly in recent years.
This U.S. International Trade Commission (USITC) staff report provides insight into many aspects of the sub-Saharan African (SSA) services sector, describing some of its general characteristics and highlighting distinctive qualities of this segment of the region’s economy. This report is a compilation of recent work, and as such, does not attempt to present summary findings or a comprehensive overview of the region’s services sector.
Despite this, a few broad themes do emerge from the analyses contained in the report. For example, overall services output and trade in SSA, while small, are growing rapidly: in many individual SSA countries, services account for more than half of total GDP. Nonetheless, several factors – including poor infrastructure and a lack of skilled workers, among others – continue to inhibit services sector expansion in the region.
An Overview of the Sub-Saharan Africa Services Market
The services markets of sub-Saharan African (SSA) are small compared to those in developed markets, with SSA as a whole accounting for only 1.8 percent of global services value added in 2014. However, services sector output in the region has grown rapidly in recent years. SSA services value added increased at a compound annual growth rate (CAGR) of 6.3 percent during 2005-14, outstripping world services sector growth (2.6 percent) by a significant margin. This chapter gives a brief overview of output and employment in the SSA services sector; highlights key markets, industries, and growth trends in SSA services trade; and discusses the relative openness of services markets in the region. The chapter concludes by focusing on one of the many issues that affect the SSA region as a whole: China’s growing presence in the region.
GDP and Employment
Services account for a large and growing share of overall SSA economic output. In 2015, the services sector accounted for 58.0 percent of SSA gross domestic product (GDP), up from 47.6 percent in 2005. However, despite rapid growth, the services share of SSA’s GDP remained significantly lower than the 2014 global average (68.5 percent, latest available data). The extent to which individual SSA countries rely on services sector output varies widely. For example, in 2015 services accounted for more than 70 percent of GDP in Cabo Verde, Mauritius, and Sao Tome and Principe. Distribution services (including restaurants and hotels) and financial, business, and real estate services are large contributors to services output in each of these countries. By contrast, services accounted for a particularly small share of output in Chad (33.4 percent) and Sierra Leone (33.9 percent) in 2015. The agriculture sector accounted for over half of GDP in each of these countries in 2015 (52.4 percent for Chad and 61.3 percent for Sierra Leone).
South Africa and Nigeria, SSA’s two largest economies, dominate the SSA services economy, respectively accounting for 29.9 percent and 27.8 percent of SSA services value added in 2015. The next-largest services market for which data are available – Sudan – accounted for only 3.6 percent. The services markets of South Africa and Nigeria are discussed in greater detail in chapter 3, along with those of four other countries which contribute at least 2 percent of SSA services value added – Kenya, Ghana, Ethiopia, and Tanzania. A specific discussion on the Sudanese services market is not included due to the relative lack of recent data available for that economy.
Sub-Saharan African Trade with the World
SSA accounted for a small share (about 2 percent) of global commercial services trade volume in 2015. However, SSA services trade volume has grown rapidly in recent years and accounted for 24.6 percent of total SSA trade in 2015. U.S. services trade with the African continent has also grown rapidly in recent years. Commercial services account for a small but growing share of total SSA trade. In 2015, commercial services accounted for 16.9 percent of total SSA goods and services exports and for 29.7 percent of imports. During 2005-15, SSA exports and imports of commercial services doubled, with exports increasing by 108.1 percent to $58.1 billion and imports increasing 120.5 percent to $156.9 billion.

South Africa is SSA’s largest commercial services exporter; however, it saw a 10.9 percent decrease in commercial services exports in 2015. Travel services accounted for the largest share of this decline (with exports in that industry falling by $1.1 billion during 2014-15), while exports in the maintenance and repair services industry decreased at the fastest rate (62.6 percent). By contrast, exports of personal, cultural, and recreational services grew by 17.2 percent to $170.1 million during 2014-15, the only increase among those South African service industries for which specific data are available.
Nigeria is the largest SSA importer of commercial services, although it, too, underwent a precipitous decline in this indicator during 2014-15; imports fell from $22.5 billion in 2014 to $18.8 billion in 2015. “Other business services” accounted for the largest share of this decline, as Nigerian imports of such services fell by 58.3 percent from $4.8 billion in 2014 to $2.0 billion in 2015.
By industry, travel services accounts for the largest share of total SSA commercial services exports, with 47.2 percent in both 2014 and 2015. In 2014, South Africa was the largest exporter of travel services by a wide margin, accounting for 35.6 percent of total SSA travel services exports, followed by Tanzania (7.7 percent), Angola (6.1 percent), and Mauritius (5.5 percent). Tourism is a key contributor to the South African economy, with one source reporting that the tourism industry supports 8 percent of jobs in that country. Industry-specific data on the SSA region’s commercial services imports are available only for transport services (which accounted for 13.5 percent of SSA commercial services imports in 2015) and travel services (which accounted for 12.9 percent).
Chinese Participation in the Sub-Saharan African Services Sector
In recent years, China has become an increasingly important economic partner of SSA, with rising trade and investment throughout the continent. While commodities and manufacturing account for large shares of this economic activity, Chinese participation in SSA services industries has also been significant. The following section presents analyses on two illustrative facets of China’s involvement in the SSA services sector: Chinese investment in the SSA financial services industry, and official Chinese assistance in SSA countries’ transport and storage industries.
Drivers of Chinese Investment in SSA Financial Services Markets
Several factors have led to increased Chinese investment in SSA financial services markets. First, increasing trade between China and SSA countries has encouraged some exporters and importers to accept settlement in renminbi (RMB) instead of U.S. dollars in payment for trade, resulting in a stronger presence of Chinese banks in SSA countries to conduct RMB-related business (although the recent depreciation of the RMB has mitigated this advantage). Traditionally, SSA countries and China have used the U.S. dollar as their primary settlement currency for bilateral trade. However, in 2009 the Chinese government began a campaign to reduce its exchange-rate risk, elevate its economic position globally, and lower firms’ transaction costs by internationalizing its currency, including expanding the use of RMB in settling international trade. This led to a rapid increase in the value of RMB cross-border trade settlements between Africa and China from just RMB 5.2 billion ($0.8 billion) in 2011 to RMB 35.8 billion ($5.7 billion) in 2012. From October 2010 to January 2013, South Africa accounted for 87.8 percent of cross-border RMB settlement between China and Africa, while Nigeria accounted for a further 6.0 percent. Standard Chartered Research predicts that, as trade settlement between China and SSA countries grows, the value of cross-border RMB settlement between Chinese firms and top importers of Chinese goods such as Nigeria, Ghana, and South Africa will likely increase. Second, the increasing presence of Chinese government-backed investment in SSA countries has prompted higher demand for Chinese banking services in the region. For instance, in June 2015, Power Construction Corporation of China, a Chinese state-owned enterprise which is mainly engaged in electricity investment and operations, signed a $1 billion contract with Amu Power Company to construct a coal-fired power plant in Lamu, Kenya. ICBC has pledged a loan of $0.9 billion to ensure the successful completion of the project. In June 2015, ICBC signed an agreement with the Angolan government to lend $840 million for the construction of the Soyo Power Plant. Further, in August 2015, Bank of China and ICBC announced that they would jointly provide $300 million to finance a 300 MW coal-fired power plant in Zambia.
Finally, the growing number of Chinese tourists in SSA has led to increasing demand for local merchants to accept the China UnionPay credit card – Chinese tourists’ preferred credit card – in several SSA countries. From 2009 to 2011, the number of Chinese tourists traveling directly to Africa nearly tripled, rising from 381,600 to 1,012,000. The UnionPay credit card is issued by China UnionPay – China’s only domestic bank card organization. China UnionPay started its African market expansion in 2007, and by 2013 UnionPay credit cards were accepted for use at ATMs in over 70 percent of SSA countries. In August 2013, UnionPay International and Mauritius Commercial Bank (MCB) jointly announced their cooperation in issuing UnionPay cards in Mauritius – the first UnionPay cards issued in an SSA country. These cards are now in circulation.
The views expressed in this working paper are those of the author and not those of the U.S. International Trade Commission or any of its Commissioners.
Related News


Green industrialisation and entrepreneurship in Africa
Changing global trends are creating new opportunities for economic transformation and green industrialization in Africa. Policies that encourage economic transformation and ‘green growth’, combined with entrepreneurship, could enable Africa to achieve a clean, resource-efficient modern economy.
Policymakers across Africa have widely embraced economic transformation as a key to help accelerate and sustain inclusive growth. Economic transformation refers to two linked development processes. One is structural change: the shift of workers and other resources from low-productivity sectors, such as subsistence agriculture, to high-productivity sectors, such as industry and modern services. The other is faster productivity growth within various sectors. Sustained robust economic growth is essential to achieve rapid job growth and poverty reduction in Africa.
Economic transformation and green growth both depend on doing new things or doing things differently: making risky investments in new, unfamiliar sectors or products or adopting new, unfamiliar methods, processes, technologies, or inputs. Therefore they depend crucially on the activity of entrepreneurs, who drive change through their innovation and risk-taking.
This paper discusses the opportunities – and challenges – for African policymakers and businesses on these three related issues: economic transformation, green growth, and entrepreneurship. Better policies and institutions, changing world markets and global technological progress have the potential to foster both economic transformation and green growth in Africa, or to better manage trade-offs between them, as well as to encourage more vigorous entrepreneurship, a key for economic transformation and green growth.
The paper synthesises the evidence on green industrialisation and entrepreneurship in Africa; analyses the relationship between structural transformation, industrial development, and the environment in Africa; and highlights a number of research gaps, particularly with respect to the role that dynamic smaller firms can play in greener industrial development.
Opportunities for greener industrial growth
Making firms more productive and attracting more investment will not be easy, as the history of African countries’ efforts to industrialise attests. These objectives do, however, provide a basis for thinking about the region’s prospects for green industrialisation.
Given the magnitude of the challenge, it is tempting to focus first on getting industrial development moving, deferring consideration of the environmental costs to a later time. Doing so would be an error. The industrialisation path taken, the choice of policies, and the capacity to absorb new energy-efficient and clean energy technologies will all significantly determine how large the increase in energy use, and its impact on the environment, will be. It makes sense for policymakers to think systematically about the environmental consequences of their industrial policy choices from the outset, both to identify potential win-win opportunities and to understand fully the trade-offs.
Increasing the prospects for greener industrial development in Africa will depend on two factors. The first is the extent to which the environmental impact of structural change may differ from the patterns associated with industrialisation in East Asia, driven in part by factors such as the region’s resource endowments, the availability of new technologies, and the changing nature of global industry. The second is the extent to which the policy interventions designed to support the drivers of firm-level productivity outlined above – the basics, exports, and agglomerations – can be adapted to support greener industrial development.
Mounting an export push
For the vast majority of countries in Africa, the regional and global export market represents the best option for rapid growth of manufacturing, agro-industry, and tradable services. Because individual firms face high fixed costs of entering export markets, there is a risk that countries will export too little unless public policies are put in place to offset the costs to first movers.
To deal with these externalities, African governments need to adopt “export push” strategies similar to those Asian countries have used since the 1970s. Asian governments adopted a set of macroeconomic and exchange rate policies, public investments, regulatory reforms, and institutional changes to increase the share of industrial exports in GDP.
Many of the public actions needed for an export push involve the basics but with the twist that priority should be given to reducing constraints on exports. Institutional and regulatory reforms should aim to reduce the transaction costs that exporters face. Duty drawback, tariff exemption, and value added tax (VAT) reimbursement schemes are often complex and poorly administered. Port clearance times are long, and customs delays on both imported inputs and exports are significantly longer than in Asia. Trade-related infrastructure is particularly weak; poorly functioning institutions and logistics markets increase trade costs.
Governments can support green exports by developing initiatives to identify green markets and support certification and standards. Africa’s regional economic communities can play a role in certification. Development partners can also give consideration to supporting green exports through trade preferences, although care must be taken in the design of such schemes, to ensure that they do not in practice serve as a form of protection against developing country exports.
Strengthening special economic zones and industrial parks – making them greener
Industrial agglomeration poses a collective action problem: if a new industrial location can attract a critical mass of firms, each firm will realise productivity gains from clustering. Until such a critical mass is reached, however, there is no incentive for a firm to move.
Governments can foster industrial agglomerations by concentrating investments in high-quality institutions, social services, and infrastructure in a limited area, such as an SEZ or industrial park.80 Appropriate public policies to attract a critical mass of investors into such areas are a prerequisite to breaking into global markets.
Most African SEZs have failed to reach the levels of physical, institutional, and human capital needed to attract global investors. A World Bank survey finds that non-African SEZs had an average monthly downtime from electricity outages of 4 hours; the average downtime in sub-Saharan African SEZs was 44 hours. A similar pattern is observed in the institutions supporting SEZs. Clearing customs takes about twice as long in African zones as it does in non-African competitors.
Experience with spatial industrial policies in North Africa has been mixed. Tunisia’s manufacturing success is based largely on its export processing zones (EPZs), which have been criticised for their limited links to the domestic economy. Egypt’s EPZs have generally been regarded as failures, especially in the public sector.
Thus, a first order of business is to raise the performance of Africa’s SEZs to international standards. The benefits of doing so include not only more rapid export growth and economic transformation but also social gains, such as greater female employment in industry. Ethiopia has demonstrated that it is possible to pursue green growth and spatial economic policies at the same time.
This Working Paper has been prepared as a supporting paper for the AfDB/OECD/UNDP report, African Economic Outlook 2017: Entrepreneurship and Industrialisation. The authors are Milan Brahmbhatt (New Climate Economy), Catlyne Haddaoui (Overseas Development Institute), and John Page (The Brookings Institution).
Opinions expressed or arguments employed in this working paper are solely those of the authors and do not necessarily reflect the official views of the OECD or its member countries, or those of the UK government (which funded the material).
Related News


tralac’s Daily News Selection
Comparative perspective: The Asian Economic Integration Report 2017
This year’s Asian Economic Integration Report (pdf) introduces a new composite index to gauge the progress of regional cooperation and integration (RCI) in Asia and the Pacific. RCI plays an important role in supporting economic growth and poverty reduction, and has been high on the development agenda for many Asian economies in recent years. Supporting RCI is one of ADB’s key strategic priorities for development assistance in the region. An index that calibrates the status of RCI can be a useful policy tool for assessing the progress of RCI efforts especially by various subregional initiatives. In 2016, Asia’s trade (by volume) grew faster than global trade, but remained below its economic growth. Asia’s trade growth picked up to 1.7% in 2016 from 1.4% in 2015, while the world trade growth decelerated to 1.3% from 2.6%. Ongoing global economic recovery lifted demand for the region’s exports, particularly from Japan; Taipei,China; Hong Kong, China; and Viet Nam.
South African industrial policy conference (CSIR)
Under the theme ‘Ideas that work for industrial development’, the 6th CSIR Conference (5-6 October) aimed to provide an interactive platform for stakeholders to share their experience and insights on broader issues relating to South Africa’s industrial development, as well as to engage on how stakeholders can collaborate to address the challenges and opportunities of industrial development. Presentations from the opening plenary sessions: Saul Levin: Industrial policy - where does innovation fit in?; Jorge Maia: Trends in and outlook for the global and South African economies; Sizwe Nxasana: Skills and innovation as a driver for industrial development in South Africa; Garth Strachan: Implementing localisation programmes in South Africa; Henk Langenhoven: Industrialisation and transformation through procurement - the Eskom experience; Ashley Bhugwandin: Localisation for industrial development [Downloads: Day 1, Day 2]
Two new tralac analyses of South Africa and global value chains:
(i) Value chains in the Global South: case studies of the Cape Town ICT sector. This paper explores the nature and dimensions of the South African ICT sector and within it, the Cape Town sub-sector. Of the sub-sectors within the ICT sector, business and software services are the highest value-add activities and these activities are the ones around which the Cape Town sector is largely based. The empirical section of the paper presents feedback from a sample of four firms located in this industry space, with a view to understanding the extent of their integration with value chains, their experiences with value chain governance and upgrading and the challenges they face in expanding their operations. [The author: John Stuart]
(ii) Global value chains – analysis of wine in South Africa. This working paper focuses on the wine industry in South Africa, highlighting the ‘big picture’ trade profile as well as key strategies that the wine industry is implementing to promote domestic, regional and global value addition. Specifically, it aims to address four issues: i) sector specificity of value chains and their impact on economic development; ii) the promotion of regional value chains as an alternative to global value chains; iii) the role of world cities as conduits for promoting value addition and the corporate services that they provide; and iv) issues of sustainability that value chains can affect (such as environmental and social side-effects). [The author: Taku Fundira]
Zimbabwe: Industry capacity utilisation drops (The Chronicle)
Capacity utilisation in the manufacturing sector for 2017 has slid by 2.3 percentage points to 45.1% from 47.4% in 2016, the Confederation of Zimbabwe Industries has said. In the 2017 manufacturing sector survey report released in Harare yesterday, CZI indicated that capacity utilisation was constrained by a number of factors with the cost or shortage of raw materials being the major constraint affecting productivity. Capacity utilisation was this year expected to reach 60% on the back of the successful bumper harvest as well as improved business conditions riding on the ongoing ease of doing business among other fundamentals.
Tanzania: Govt issues bold statement against EAC trade barriers (The Citizen)
The government has vowed to respond accordingly to any East African country which will impose trade barriers for products from Tanzania. The remark was made yesterday by the permanent secretary of the Industry Trade and Investment ministry, Prof Adolf Mkenda, when releasing findings of the top 100 mid-sized companies’ survey, whose winners will be named today. “Tanzania is totally committed to allow imports from other countries, but we won’t accept to be a dumping place,” noted Prof Mkenda. “We won’t spare those who will dare impose some barriers for our exports as opposed to the East African Common Market Protocol. They know very well on what can happen,” he said in response of a question on measures that they would take against those countries. He said the potential benefits of further reducing those obstacles are significant given that the opening of markets was important in boosting trade and economic growth in the region.
Uganda: 8th Sector Review Conference (Ministry of Trade Industry and Cooperatives)
This year’s Sector Review was organized under the theme ‘Promoting value addition and competitiveness in export growth’. Market expansion through regional and international trade agreements (pdf). The COMESA trading bloc is the main destination for Uganda’s exports for the period of 2005/06 to 2016/17, with the share in total export earnings increasing on average throughout the years (from $ 223.15m [26.58%] in 2005/06 to $ 1,243.29 [46.39%] in 2016/17). The EU market ranked the second highest destination for Uganda’s products, although the share in total export earnings has been reducing to 18.92% [$ 506.94m] in 2016/17. The Middle East bloc followed, accounting for 18.85% [$ 505.26m] of the total market share in the same period followed by Asia, Rest of Africa, Rest of Europe and America, in that order. Among the COMESA member countries that contributed significantly to export earnings were Kenya, South Sudan, Rwanda, DRC, accounting for $422.99m, $239.25m, $193.98m and $177.66m in 2016/17 respectively.
Nigeria’s custom agents: Shipping firms violating FG’s Ease of Doing Business directive (ThisDay)
Customs agents in the country have called on the federal government to urgently check the unlawful activities of shipping companies and terminal operators whose actions they said hinder imports and exports and violate the ease of doing business directives issued by the government. In a petition addressed to Vice President Yemi Osinbajo, the customs agents alleged that the shipping companies and terminal operators’ charges on storage contravene Sections 20, 31 and 97 of the Customs and Excise Management Act that limit the days for rent charges and conferred authority to Nigeria Custom to charge rent after specific days by the board.
Indonesia-Nigeria trade: Osinbajo canvasses repositioning of Africa’s economy (The Tide)
Vice President Yemi Osinbajo has called on Africa to reposition its economy in the direction that will attractive investors because investment depends on the advantages derivable. Osinbajo made the call while interacting with a committee of African Ambassadors to Indonesia, led by the dean of the group, Ms Alice Mageza of Zimbabwe, on the sideline of his two-day working visit to Jakarta. The Ambassadors included those of Egypt, Ethiopia, Algeria, Libya, Morocco, Mozambique, Somalia, South Africa, Sudan and Tunisia. On the kinds of investments that Africa desires, Osinbajo said Africa must focus on the manufacturing sector. He noted: “the most important thing for Africa is that whoever wants to invest in our countries should start in manufacturing.” He, however, urged African diplomats in Indonesia to work together in the quest for attracting investment opportunities to Africa. Osinbajo said “if you negotiate together, it is probably going to be more effective than if we negotiate separately”.
The 25 best-performing companies in Africa 2016 (Global Finance)
It is a diverse group of companies that makes the list this year. The ranking is dominated by South African firms, which hold 14 spots. Egypt boasts five companies in the list, and Kenyan companies take up three places. Rounding out the rankings, in addition to Morocco’s third-place showing, are Chobe Holdings, an ecotourism company from Botswana - in sixth place - and Tunisian auto dealer Artes (Automobile Réseau Tunisien et Services). One key difference in this year’s list is that it includes decidedly fewer petrochemicals and mining companies—a clear indication of the impact extended low oil and commodity prices are having on major economies in the region.
Africa Financial Markets Index (OMFIF)
The Index ranks the maturity, openness and accessibility of 17 financial markets in Africa, based on both qualitative and quantitative criteria. Development of local investor capacity and ability to attract foreign capital are key points of focus. The markets surveyed are Botswana, Egypt, Ethiopia, Ghana, Ivory Coast, Kenya, Mauritius, Morocco, Mozambique, Namibia, Nigeria, Rwanda, Seychelles, South Africa, Tanzania, Uganda and Zambia. The Index intends to track progress annually, supplying a toolkit for countries wishing to build financial infrastructure. Given its size and historical position, South Africa tops the 2017 list, despite poor recent macroeconomic performance, based on the strength of its financial markets as well as its relative openness and transparency for transactions. Others are closing the gap. Mauritius and Botswana have strengths in tax and regulation and access to foreign exchange. Kenya and Ghana provide signs of progress. Ivory Coast, with a low overall score, is home to a growing regional bourse, pointing to future improvement. Ethiopia shows the highest GDP growth prospects of the 17 countries – even though it comes bottom of the list in terms of financial market prowess.
African leaders urged to create gas pricing index (ThisDay)
Africa should develop a gas pricing index based on the cost of electricity set midway between existing global benchmarks to ensure fairer pricing in new export projects on the continent, two African ministers said. “The pricing of the LNG coming into Africa is going to be more than 50 percent for electricity, so it will be fixed to the price of electricity,” Equatorial Guinea’s minister Gabriel Obiang Lima told Reuters during the Africa Oil Week conference. “What we need to calculate is the pricing of the power to be able to have this index and that should be something between (the U.S. gas exchange) Henry Hub, which is very low, and the Asian index, so we are talking about a range of between $3-$7 dollars,” he said on the sidelines of the meeting in Cape Town.
Generation 2030 Africa 2.0 (UNICEF)
- - -
Related News

Uganda: 8th Annual Joint Trade, Industry and Cooperatives Sector Review
The Trade sector is one of the key sectors that contribute to the economic development of the country.
Every year sector stakeholders meet at a conference to review the performance of the Sector and also establish feasible interventions and strategies to boost the Sector. This year’s Sector Review is organized under the theme “Promoting value addition and competitiveness in export growth”.
The theme emphasizes the contribution of Value addition and competitiveness towards reducing the balance of payment deficit in the Country. It also stresses the need towards realization of the objectives of the Sector Development Plan, the NRM Manifesto, the National Development Plan II and the Vision 2040; all aimed at ensuring sustainable socio-economic transformation of Uganda.
Sector Priorities: During the last Financial Year 2016/2017, great strides were made in the development and implementation of sector policies and programmes. In line with the Ministry’s mandate and in accordance with NDPII, the sector prioritizes; improving the Private Sector competitiveness and increase the market access for Uganda’s products and services in regional and international markets; improving the stock and quality of trade infrastructure; increasing the share of manufactured goods and services in total exports; and promoting the formation and growth of cooperative enterprises.
Trade development
The sector notes the persistent trade deficit through the period (2012-2016) with the highest trade deficit of US$3.462 Million registered in 2014/15. The situation is mainly arising out of the low value of exports which are mainly unprocessed agricultural commodities while exchanging them for high value manufactured products.
Exports: In 2016 the trade deficit reduced to US$1.993 Billion from US$2.926 Billion in 2015 which is attributed to the overall increase in export earnings by 8.8% in 2016. Total export earnings were US$2.901 Billion of which US$ 2.482 Billion were formal exports. The formal exports increased by 9.5 percent from US$ 2.267 Billion in 2015 to US$ 2.482 Billion in 2016 while informal exports increased by 5 percent from US$ 399.1 million to US$ 419.2 million over the same period.
Overall, coffee remained the main merchandise foreign exchange earner of the country for the above period. However, its share to total formal exports reduced from 17.91% in 2015 to 16.50% in 2016.
Imports: The total imports bill in 2016 stood at US$ 4.89 Billion, of which, formal imports accounted for US$ 4.82 Billion, while informal imports were estimated at US$ 64.9 million. The total imports expenditure declined by 12.5 percent in 2016 after a decrease of 8.9 percent in 2015.
Uganda continues to pay high bills for imports of Machinery Equipments, Vehicles & Accessories goods amounting to US$ 947.11 million (23.99%) in 2016/17; followed by Petroleum Products of US$ 693.80 million (17.57%); Vegetable Products, Animal, Beverages, Fats & Oil of US$ 454.66 million (11.52%); Chemical & Related Products of US$ 430.61 million (10.91%) and others in that order.
Interventions to address the deficit
The Sector is employing several strategies to ensure increased volume of exports while reducing import volumes. These include:
The National Export Development Strategy (NEDS)
The Strategy was approved by Cabinet on 25/08/2017. It envisions a focused and dynamic export sector fully responsive to available export opportunities, especially in preferential markets. The overriding objective of NEDS is to increase the value of Uganda’s exports of the specified products and services to the targeted markets over the next five years. It intends to narrow the trade deficit as a percentage of total exports from the current annual average of negative 96% to at most negative 35% over the next five years.
Priority Products under NEDS are categorized as follows:
-
High priority: coffee, iron/steel products, fish, cement, tobacco, sugar, flowers and tea.
-
Medium priority: Hides & skins, cocoa, sim sim, maize, plastics, rice, cotton, fruits & vegetables.
-
Low priority: beans.
Promotion of trade in services
A National Policy on Services Trade was approved by Cabinet on 19/07/2017 which is aimed at boosting trade in services and cause a reduction in the trade deficit. Successful implementation of the policy is expected to contribute significantly to achieving the targeted USD 5 Billion value in exports by 2020, incrementally growing by US$ 500 annually over the next five years.
Priority sectors include: tourism, transport/distribution, education, business services, construction and related engineering services, insurance, among others.
Market Expansion through Regional and International Trade Agreements
The COMESA trading bloc is the main destination for Uganda’s exports for the period of 2005/06 to 2016/17, with the share in total export earnings increasing on average throughout the years (from US$ 223.15 million [26.58%] in 2005/06 to US$ 1,243.29 [46.39%] in 2016/17).
The EU market ranked the second highest destination for Uganda’s products, although the share in total export earnings has been reducing to 18.92% [US$ 506.94 million] in 2016/17. Middle East bloc followed accounting for 18.85% [US$ 505.26 million] of the total market share in the same period. Asia, Rest of Africa, Rest of Europe, America followed in that respective order.
Among the COMESA member Countries that contributed significantly to export earnings were Kenya, South Sudan, Rwanda, D.R. Congo, accounting for US$ 422.99 million, US$ 239.25 million, US$ 193.98 million and US$ 177.66 million in 2016/17 respectively (90.60% composition of Uganda-COMESA trade).
Other Regional Trade Arrangements
Uganda is a signatory to a number of trade and traderelated agreements through which market opportunities have been achieved;
-
East African Community Customs Union
-
The African, Caribbean and Pacific- European Union (ACP/EU) Partnership Agreement (Cotonou Agreement)
-
World Trade Organization (WTO), and
-
African Union (AU)
Uganda is also a beneficiary of non-reciprocal unilateral trade preferences such as Everything-But-Arms (EBA) by the European Union.
-
EAC-SADC-COMESA Tripartite Agreement
-
The African Growth and Opportunity Act (AGOA) of the United States and offers by Canada, Japan and China under the Generalized System of Preferences (GSP).
-
Other on-going engagements include the Continental Free Trade Area (CFTA) negotiation and the EAC-EU Economic Partnership (EPA) negotiations among others.
One Stop Border Posts (OSBPs)
With Support from the Department for International Development (DFID), through TradeMark East Africa, construction of three OSBPs was completed; these include Mutukula OSBP with Tanzania, Busia OSBP with Kenya, and Mirama Hills OSBP and Mirama Hills Road with Rwanda. All the border posts are operating under one stop control which means that a transporter or traveller clears only once, on one side of the border.
-
Construction of Elegu border post with South Sudan is underway.
-
Elimination of Non-Tariff Barriers: With surport from TMEA the ministry is implement a web based Non-Tariff Barrier Reporting System that has helped in easing and enabling the reporting and resolution of NTBs among trade facilitating institutions. This, in turn has reduced on the delays and costs of moving goods in and outside of Uganda across trading member states.
-
86% resolution of all NTBs reported through the system by using the user dials USSD Code *201#
Industrial development
The growth rate of the industrial sector stands at 3.4 percent and the sector contributes 19.6 percent of GDP. Manufacturing contributes 9% to GDP with a growth rate of 2.5%. Major industries: sugar, tea, Beverage, cement, steel production, cotton textiles Potential industries: Oil and gas, Iron & Steel, gold refining, fertilizer, leather etc.
Government initiatives to develop the sector
The Ministry is undertaking the following initiatives to ensure growth of industrialization so as to increase the exportation of processed products for increased export earnings.
1. Legal and Regulatory Framework for industry
The Ministry is in the process of developing new laws to regulate the sector. These include; Industrial Development Bill, Legal metrology bill, Accreditation bill, Industrial and scientific metrology bill, Sugar Bill, Alcohol Bill. The Ministry is also developing sector policies like the iron and steel policy, packaged water policy among others
2. Rural Industrial Development Project (RIDP)
The Ministry is promoting value addition through the RIDP. A total of 53 projects have been supported across the country and out of these projects, 45 enterprises (85%) have been supported with value addition equipment and 8 enterprises were supported with capacity building in the areas of business management and value addition skills, product quality and standards requirements principles of cooperative movement.
3. Government Trustees
Three (3) institutions including the Textile development Agency, Uganda Leather Training and common Facility Centre, Uganda Cleaner Production Centre. The three have been made Government trustees for purposes of inclusion in Government planning, proper supervision of programs and activities, accountability and enhancing implementation of Government Policies.
4. Support to Micro, Small Medium Enterprises (MSME)
The Directorate of MSMEs that was established in June 2016 is fully functional. the directorate is responsible for implementing the MSE policy which provides a regulatory and institutional framework for MSME Development activities with a theme “Sustainable MSMEs for wealth creation and socio economic transformation” as aligned with the objectives of the National Development Plan II (2015/2020).
The MSE Directorate signed an MOU with financial sector Deeping Uganda (FSDU) to promote the development of MSMEs. The directorate has so far profiled and evaluated 1500 MSMEs in the selected districts of Gulu, Hoima and Kiryandongo.
Key planned activities for FY2018/19
The budget for the Financial Year 2018/19 stands at shillings UGX 103.66 billion and the Sector plans to undertake the following activities for the Financial Year 2018/19:
-
Enhance value addition and industrialization to support job creation;
-
To revitalize the Cooperative Movement by mobilizing collective resources through cooperatives;
-
Continue to improve the Regulatory Framework for creating an enabling environment for Trade that enhances wealth creation;
-
Continue to address Non-Tariff Barriers to Trade in the Country;
-
Ensure implementation of the National Development Export Strategy (NEDS) and;
-
Continue undertaking Technical Guidance, Inspections & Compliance monitoring Field Visits aimed at enhancing implementation of Industrial Development Initiatives.
Related News
Strong Asian intraregional trade and investment improve economic resilience
Growing trade and investment linkages in Asia and the Pacific help improve the region’s economic resilience to uncertainties in the global economic and trade policy environment, according to a new Asian Development Bank (ADB) report.
In a study released on 25 October 2017, the Asian Economic Integration Report 2017 (AEIR), ADB examines recent regional integration trends and introduces a new regional integration index. The report also includes a special chapter on how Asia can strengthen financial resilience in an era of financial interconnectedness.
Strong intraregional trade and investment are acting as a buffer for the region against uncertainties in global trade and economic growth, according to the report. In 2016, Asia’s intraregional trade share – measured by value – rose to 57.3% in 2016, a record high, up from an average of 55.9% from 2010 to 2015.
Foreign direct investment (FDI) within Asia rose in absolute value to reach $272 billion in 2016, despite a 6% decline in global FDI flows into the region. This intraregional FDI increased as a share of total FDI to the region from 48% in 2015 to 55% in 2016. Given the role intra-Asian FDI plays in enhancing global and regional value chain development, this is expected to help strengthen the region’s trade growth globally.
Asian economies have continued expanding their global presence, with FDI originating from Asia rising 11% in 2016 to $482 billion, primarily through investment in renewable energy, natural resources, semiconductors, and information technology.
“Asia and the Pacific is leading a recovery in world trade that is helping the region to maintain strong growth momentum amid global economic and trade policy uncertainty,” said Yasuyuki Sawada, ADB’s Chief Economist. “Asia’s continued integration and cooperation will underpin regional economic growth and financial resilience.”
The 2017 AEIR introduces a new composite index, the Asia-Pacific Regional Cooperation and Integration Index. The index measures regional integration across six components, including trade and investment, money and finance, regional value chains, infrastructure and connectivity, movement of people, and institutional and social integration. The index is aimed at helping policymakers better understand and measure the levers for greater regional integration and cooperation.
The report also features a special chapter on how Asia can strengthen financial resilience in an era of financial interconnectedness. It highlights that 20 years after the Asian financial crisis, Asia stands strong, with healthier financial systems, stronger regulations, and better regional financial cooperation mechanisms.
Significant challenges remain, however, with unresolved financial market and system weaknesses. Remaining regulatory policy gaps could also increase the region’s risk exposure and financial vulnerability through excessive leverage and risk-taking.
The report offers several recommendations for countries in the region to strengthen their resilience to future crises, including maintaining sound macroeconomic fundamentals; further strengthening national regulatory and supervisory frameworks and institutional capacities; further developing local currency bond markets; strengthening regional regulatory cooperation, including resolution mechanisms for interconnected regional banks; and reviewing and strengthening existing financial safety nets against potential contagion and spillover effects.
ADB, based in Manila, is dedicated to reducing poverty in Asia and the Pacific through inclusive economic growth, environmentally sustainable growth, and regional integration. Established in 1966, ADB is celebrating 50 years of development partnership in the region. It is owned by 67 members – 48 from the region. In 2016, ADB assistance totaled $31.7 billion, including $14 billion in cofinancing.
