News
WTO report: “G20 trade restrictions reach highest monthly level since the crisis”

The WTO’s fifteenth trade monitoring report on G20 trade measures, issued on 21 June, shows the application of new trade-restrictive measures by G20 economies increased compared to the previous reporting period, reaching the highest monthly average registered since the WTO began its monitoring exercise in 2009.
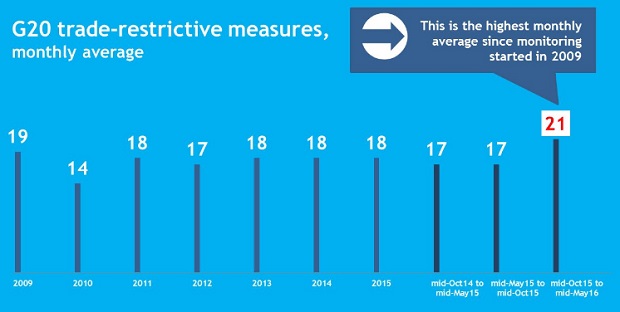
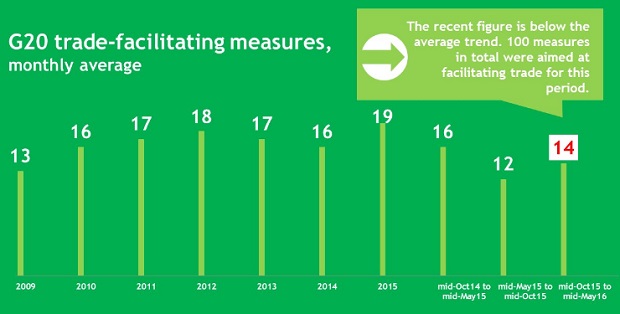
In the period under review (mid-October 2015 to mid-May 2016), G20 economies applied 145 new trade-restrictive measures, or an average of almost 21 new measures a month. In the same period, G20 economies implemented 100 measures aimed at facilitating trade, averaging just over 14 per month. Since 2009, a total of 1,583 trade restrictive measures were imposed by G20 countries, and only a quarter of these measures have been removed. These restrictions cover over 6% of all G20 imports and 5% of global imports.
Commenting on the report, WTO Director-General Roberto Azevêdo said:
“We have long been concerned about the growing stockpile of trade-restrictive measures, and our report suggests that this worrying trend is continuing. A rise in trade restrictions is the last thing the global economy needs today, with GDP growth sluggish and 2016 expected to be the fifth year in a row that trade has expanded by less than 3%.
“These trade-restrictive measures, combined with a notable rise in anti-trade rhetoric, could have a further chilling effect on trade flows, with knock-on effects for economic growth and job creation. If we are serious about addressing slow economic growth then we need to get trade moving again, not put up barriers between economies. The G20 economies have made a commitment to lead in this endeavour as the world’s largest traders. I urge them to act on this commitment.”
The main factor behind the rise in trade-restrictive measures was an increase in the number of trade remedy investigations by G20 economies. Anti-dumping actions account for the majority of restrictive measures imposed, with most of the investigations concentrated in sectors such as metals (particularly steel) and chemicals. G20 members also imposed more distortive measures in the form of government support for sectors such as infrastructure, agriculture and export-specific activities.
On a positive note, WTO members are using the forums provided by the organization to address potential trade frictions constructively and transparently, rather than through dispute settlement or resorting to unilateral measures. This underlines the importance of the WTO as a platform for addressing such concerns.
The G20 economies are Argentina, Australia, Brazil, Canada, China, France, Germany, India, Indonesia, Italy, Republic of Korea, Japan, Mexico, the Russian Federation, Saudi Arabia, South Africa, Turkey, the United Kingdom and the United States, as well as the European Union.
Key findings
-
In the review period between mid-October 2015 and mid-May 2016, G20 economies applied 145 new trade-restrictive measures, equating to an average of almost 21 new measures per month. This indicates a significant increase compared to the previous reporting period at 17 per month.
-
This is the highest monthly average registered since the beginning of the monitoring exercise in 2009 which helps explain that the overall stockpile of restrictive measures introduced by G20 economies grew by 10% during the review period.
-
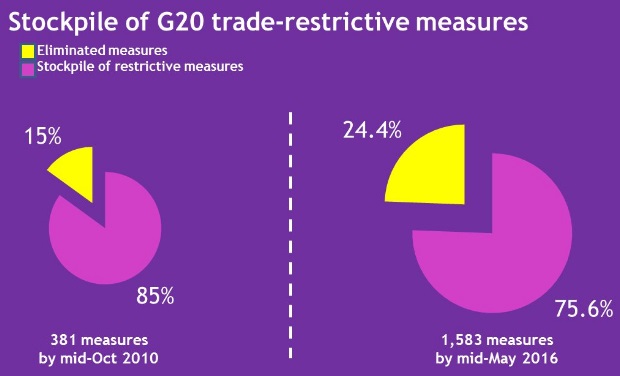
Of the 1,583 trade-restrictive measures, including trade remedies, recorded for G20 economies since 2008 by this exercise, only 387 had been removed by mid-May 2016. The total number of restrictive measures still in place now stands at 1,196.
-
Although some G20 economies have been eliminating trade restrictions, the rate by which this is done remains too low to dent the stockpile of such measures. Of the total number of trade-restrictive measures recorded for G20 economies since 2008, the share of eliminations, or roll-back, make up less than 25%.
-
The report also finds that during the reporting period a total of 100 measures aimed at facilitating trade were taken – a monthly average of 14 measures. This represents an increase compared to the previous reporting period, but remains below the average trend observed since 2010.
-
At the same time, the number of trade remedy investigations initiated by G20 economies has increased during this reporting period, representing 61% of trade restrictive measures, a share that remained slightly higher than the average share observed since 2009.
-
General economic support measures implemented by G20 economies appear on the rise. The review period recorded a monthly average of such measures comparable with the number recorded immediately after the onset of the global financial crisis.
-
World trade remained volatile in 2015 as diverging outlooks for developed and developing economies unsettled global financial markets and prompted sharp movements in commodity prices and exchange rates. The volume of world merchandise trade grew 2.8% last year as trade fell sharply in the first half of the year before recovering in the second half.
-
Prospects for world trade in 2016 and beyond remain uncertain. The most recent WTO trade forecast of 7 April 2016 predicted merchandise trade volume growth of 2.8% in 2016, unchanged from 2015. Despite a number of positive developments, the global environment remains challenging and continued vigilance is required.
-
In the midst of this uncertainty, G20 economies must lead by example in the fight against protectionism by rejecting new trade-restrictive measures and rolling back existing ones.
-
The WTO will continue to monitor trade policy trends and developments in the G20 economies and provide a transparent and predictable platform for addressing the challenges facing the global trading system today.
WTO report on G-20 trade measures: Executive Summary
This is the fifteenth WTO monitoring report on G20 trade measures. It covers the period from 16 October 2015 to 15 May 2016.
During this seven-month period, there seems to be a relapse in G20 economies’ efforts at containing protectionist pressures. Not only is the stockpile of trade-restrictive measures continuing to increase, but also more new trade restrictions were recorded during the period, in particular trade remedy investigations and local content requirements.
The implementation of new trade-restrictive measures by G20 economies increased over the period covered by this report. Since mid-October 2015, G20 economies applied 145 new trade-restrictive measures – an average of almost 21 new measures per month, compared to 17 in the previous report. An increase in the number of trade remedy investigations by G20 economies together with local content measures constitute the main factors behind this upward trend in the overall monthly figure. During the review period, G20 economies initiated more than twice as many trade-remedy investigations than terminations.
During the same period, G20 economies implemented 100 measures aimed at facilitating trade. At just over 14 trade-facilitating measures per month, this represents an increase over the previous report. If trade remedies are excluded, G20 economies implemented slightly more trade facilitating than trade-restrictive measures over the review period.
Overall, the stockpile of restrictive measures introduced by G20 economies continues to grow. Of the 1,583 trade-restrictive measures (including trade remedies) recorded for G20 economies since 2008, only 387 had been removed by mid-May 2016. The total number of these restrictive measures still in place now stands at 1,196 – up by 10% compared to the previous report. Although some G20 economies are eliminating trade-restrictive measures, the rate at which this is done is far too low to dent the overall stockpile of restrictive measures. Of the total number of trade-restrictive measures recorded for G20 members since 2008, the share of eliminations, or roll-back, make up less than 25%.
World trade was volatile in 2015 as diverging outlooks for developed and developing economies unsettled global financial markets and prompted sharp movements in commodity prices and exchange rates. The volume of world merchandise trade grew by 2.8% last year as trade fell sharply in the first half of the year before recovering in the second half. Weak import growth in developing economies (0.2%) was cushioned by stronger import demand in developed countries (4.5%). Import growth was particularly weak in large emerging economies such as China (-4%) and Brazil (-15%). Meanwhile, exports grew slightly faster in developing economies (3.3%) than in developed countries (2.6%). This was balanced by stronger positive import growth in the United States (6.5%) and the European Union (4.5%). Despite positive trade growth in volume terms, the dollar value of world trade fell sharply (-13% for merchandise, -6% for services), largely as a result of lower commodity prices and the general appreciation of the US dollar.
Prospects for 2016 and beyond remain uncertain. The most recent WTO trade forecast of 7 April 2016 predicted merchandise trade volume growth of 2.8% in 2016, unchanged from 2015, but volatility is likely to persist. Exports of developed and developing economies should grow at around the same rate (2.9% in the former and 2.8% in the latter). Meanwhile, imports of developed economies are expected to outpace those of developing countries, with an increase of 3.3% compared to a rise of 1.8%. Preliminary trade volume statistics for the first quarter of 2016 indicate that world trade fell around 1% in the first quarter compared to the last quarter of 2015.
The number of trade remedy investigations initiated by G20 economies has increased during the review period. Metal products, and in particular steel products, chemicals and plastics and rubber account for the largest shares of anti-dumping and countervailing initiations.
Around 70% of G20 trade remedy investigations targeted products from other G20 members. Since 2015, initiations on products from other G20 members have accounted for at least 50% of each individual G20 member’s total initiations. As for previous review periods, anti-dumping measures made up the overwhelming majority of trade remedy actions taken.
The analysis of sunset reviews of anti-dumping and countervailing measures initiated in 2008 and 2009 seems to indicate that there is no discernible change in extensions versus expiry of measures coinciding with the financial crisis.
On Sanitary and Phytosanitary (SPS) measures, G20 economies remain active with their notifications, accounting for 7 out of every 10 of all notifications to the SPS Committee. Over three-fourths of the specific trade concerns (STCs) discussed in the Committee addressed measures maintained by G20 economies. Similarly, the vast majority of STCs were raised by G20 members. In the area of Technical Barriers to Trade (TBT), the share of STCs that were directed at TBT measures, either proposed or adopted, by G20 members increased very substantially in the review period.
Agricultural policies of G20 economies were the subject of most questions under the review process of the Agreement on Agriculture (AoA). Despite the poor notifications’ compliance recorded for some G20 economies, WTO Members continue to pose questions on G20 implementation of commitments, particularly those in relation to domestic support policies.
This report suggests that general economic support measures implemented by G20 economies are on the rise with the monthly average of such measures recorded in the review period approaching the number recorded immediately after the onset of the global financial crisis. However, the numerical counting of such measures and programmes does not provide any indication regarding the extent of these measures nor their impact. The main beneficiaries of such support included a number of infrastructure programmes (including several energy-related projects), various industries in the manufacturing sector, the agricultural sector and the telecommunications sector.
Several programmes provided specific support to export-related activities or enterprises, including SMEs. Several important policy developments in a very diverse range of services sectors took place during the review period. The overwhelming majority of these services measures go in the direction of either further liberalization of trade in services or the strengthening and clarification of relevant regulatory requirements.
The OECD has contributed two topical boxes to this report. The first looks at the evolving agricultural policies and markets and the implications for multilateral trade reform. The second seeks to assess the gains from implementing the WTO Trade Facilitation Agreement (TFA).
This fifteenth report on G20 trade measures has outlined the profound volatility which characterizes world trade today and the current unsettled nature of international financial markets. Despite a number of positive developments, the global environment remains challenging. In the midst of this uncertainty, the G20 economies must lead by example in the fight against protectionism by rejecting new trade-restrictive measures and rolling back existing ones.
Fifteenth UNCTAD-OECD Report on G20 Investment Measures
As the global financial crisis broke in 2008, G20 Leaders committed to resisting protectionism in all its forms at their 2008 Summit in Washington. At their subsequent summits in London, Pittsburgh, Toronto, Seoul, Cannes, Los Cabos, St Petersburg, Brisbane and Antalya, they reaffirmed their pledge and called on WTO, OECD, and UNCTAD to monitor and publicly report on their trade and investment policy measures.
The present document is the fifteenth report on investment and investment-related measures made in response to this call. It has been prepared jointly by the OECD and UNCTAD Secretariats and covers investment policy and investment-related measures taken in the seven months between 16 October 2015 and 15 May 2016.
Investment policy measures
G20 Members have taken few investment policy measures in the reporting period, albeit slightly more than in the recent previous reporting periods. The inventory classifies these policy measures into four categories: measures specific to FDI, investment measures related to national security, measures not specific to FDI, and International Investment Agreements (IIAs).
The majority of the investment policy changes introduced by G20 economies between October 2015 and May 2016 enhanced openness for foreign investment. This confirms the long term trend since the monitoring exercise began. Among the G20 investment policy measures taken since 2009 and recorded in this series of inventories established by OECD and UNCTAD, over 80% of measures specific to FDI – expressed in numbers – were liberalizing in nature.
This does not mean however that investment abroad has generally become easier or more attractive. Many factors that home and host countries control influence the possibility and viability of foreign investment, and the measures included in this inventory are only the formal changes that governments have made. Beyond is a series of more informal or less traceable measures – such as the administration of existing policies, the exercise of discretion, and the signals governments send to investors – that influence whether investors feel confident to invest abroad.
While the present inventory cannot trace these developments – essentially because these decisions and their motivations are often not publicly documented – G20 Members should bear in mind that they will only reap the benefits of foreign investment if they demonstrate openness and transparency in practice.


