News
Benchmarking productive capacities in least developed countries

At the 13th session of the United Nations Conference on Trade and Development (UNCTAD XIII), which took place in Doha, Qatar, in April 2012, member States requested UNCTAD to develop quantifiable indicators with a view to providing “an operational methodology and policy guidelines on how to mainstream productive capacities in national development policies and strategies in LDCs” (Doha Mandate, para. 65(e)).
The present report, which is part of ongoing work by the secretariat and a response to the above-mentioned request, focuses on measuring and benchmarking productive capacities in least developed countries (LDCs): their current levels; how LDCs have performed in the recent past; and how the productive capacities in LDCs compare with the internationally agreed goals and targets and with other developing countries.
It is found that LDCs generally lag behind other developing countries with respect to most indicators, although there is considerable heterogeneity in both groups of countries. The overall impression of the LDC group as a whole is that the development of productive capacities in these countries is advancing, but that the progress is slow and that the challenge of meeting the objectives of the Istanbul Programme of Action (IPoA) by 2020 is daunting.
Although specific policy recommendations must be done on a case-by-case basis, general themes that recur in LDCs include the need to improve data collection and data management, to build national statistical and database management capacities, to continually undertake reforms and to support and promote additional investment in and financing of productive capacities. The development partners of LDCs have important roles to play, including by rebalancing the sectoral distribution of official development assistance (ODA), by improving market access and by channelling resources from the Aid for Trade initiative to augment productive and supply capacities of LDCs.
Introduction
When the least developed country (LDC) category was created in 1971, the General Assembly of the United Nations formally endorsed an original list comprising 25 countries. The newly created group soon expanded and in the 40-odd years that followed saw a net increase of 24 countries. Thus, when South Sudan was added to the list in 2012, the total number of LDCs was brought to the current 49 countries. The expansion of the LDC list over the past four decades can in part be attributed to some countries gaining independence during the period, but in other cases it has been due to the socioeconomic conditions of some countries deteriorating to such an extent that they have been found eligible for inclusion. Meanwhile, there have only been three instances of the opposite scenario, that is, of countries that have managed to graduate from their LDC status and hence be removed from the list. The four ex-LDCs to date are Botswana, Cabo Verde Maldives, and Samoa.
The ambition of LDCs and their international development partners is to reverse the trend of a growing LDC category and enable half of them to graduate by 2020. As in the preceding decades, they adopted a programme of action, the Programme of Action for the Least Developed Countries for the Decade 2011-2020 (Istanbul Programme of Action (IPoA)), which sets out a host of concrete goals and targets across eight priority areas. These serve as the means to the proclaimed overarching end: “to overcome the structural challenges faced by the least developed countries in order to eradicate poverty, achieve internationally agreed development goals and enable graduation from the least developed country category” (para. 27).
One of the priority areas identified in the IPoA is productive capacities, which are regarded as an indispensable element for LDC development. LDC economies may well expand due to windfall gains from natural resource discoveries, tariff preferences or other income sources that are only weakly related to any actual competitiveness. Yet for LDCs to overcome supply constraints and spur structural transformation, boosting their productive capacities is a sine qua non. It is only by improving their infrastructure; energy production; science, technology and innovation; and private sector development that they may be able to follow a path towards long-term growth that is sustainable and inclusive. To be sure, other ingredients are needed as well – as reflected in the other priority areas of the IPoA – and building productive capacities should thus be seen as a necessary but insufficient condition for LDC development.
An integral part of the effort to develop productive capacities is the need to measure their levels and specify benchmarks against which conditions and the state of such capacities may be assessed. This exercise is not of mere academic interest, but is of great value for policymaking. After all, it is clearly more effective to know where one is and where one wants to go before deciding on which route to take. It is also useful to measure and benchmark the level of productive capacities in order to review how far one has come and why. Monitoring assists in evaluating where past policy choices may have gone right or wrong and, consequently, points to policies, processes and actions that need to be remedied or embraced. Yet another potential benefit from measuring and benchmarking is the insights that may be discerned from cross-country comparisons. Quantitatively assessing productive capacity levels past, present and future (aspired) for several countries can provide valuable lessons learned and best – as well as worst – practices.
In theory, productive capacities cover a range of issues that may be thought of as falling into one of three categories: productive resources; entrepreneurial capabilities; and production linkages. There are a number of indicators related to the various categories and subcategories, but since the indicators inherently highlight certain aspects at the expense of others, it is imperative to take into account as many as possible in order to form a comprehensive picture of the level of each country’s productive capacity, although paucity of data and statistical information poses formidable challenges. Rail and road networks, telephone lines and electricity production are among the indicators related to a country’s physical infrastructure, while the value added share of manufacturing, the share of employment in manufacturing and diversification indices are valuable indicators for reviewing the role of manufacturing in an economy. Although a high number of indicators is welcome in that they help to provide a broad view of a country’s condition and progress, their multitude also presents a challenge in terms of how they may be condensed to a comprehensible and balanced summary of the conditions of productive capacities in LDCs.
Productive capacities in LDCs
An important exercise to facilitate strategic policymaking in developing productive capacities is to assess the current state of LDC productive capacities vis-à-vis the declared objectives and other relevant benchmarks. This section sets out to do so. The point of departure is the IPoA and, especially, the goals, targets and actions that it lists for productive capacities. Thus, the four main themes of the priority area are covered in this section. It also includes analyses of structural transformation in LDC economies (for a more generic assessment of their productive capacities) and of financing and investing in productive capacities (to review the efforts that have been made to develop them). In particular, this section covers the facets of productive capacities in the following order:
-
Structural transformation
-
Infrastructure
-
Transport
-
ICT
-
-
Energy
-
Science, technology and innovation
-
Private sector development
-
Financing and investing in the development of productive capacities
All subsections discuss the latest data available for a range of indicators. They compare how LDCs are progressing with respect to one another as well as against certain benchmarks and seek to identify causes for the varied performances. When relevant, they highlight best and worst practices in developing productive capacities. Some subsections also feature what-if analyses that show the progress needed to attain specified targets or particular benchmarks.
Structural transformation
The section on productive capacities in the IPoA contains two goals that relate to the economic structure of LDCs: (a) to increase the value addition in natural resource-based industries; and (b) to diversify local productive and export capability, especially in agriculture, manufacturing and services. No quantitative targets are identified, which is understandable since the optimal structure of an economy differs across countries. However, by including them among the main goals in the section, it is clear that the IPoA recognizes the need for LDCs to pursue value addition and diversification in their efforts to develop productive capacities.
Diversification
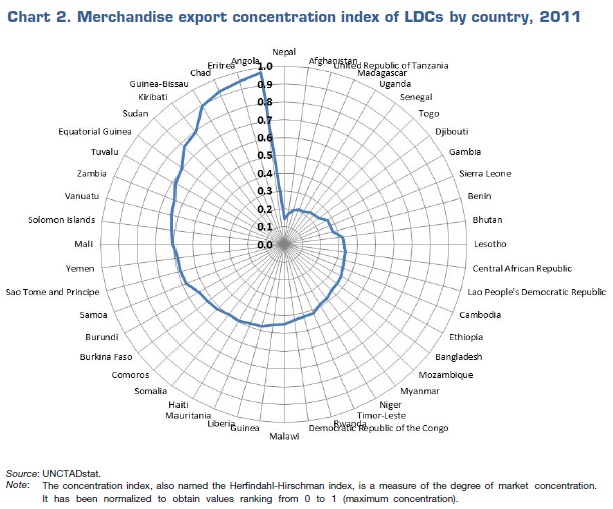
The merchandise export concentration index (or Herfindahl-Hirschman index) gives an indication of the extent to which production in LDCs is specialized, and is summarized in chart 2. It shows that the concentration for 4814 LDCs in 2011 ranged from 0.14 (Nepal) to 0.97 (Angola). The unweighted average (mean) was 0.47 and the median was 0.44. By comparison, the unweighted average of all of the world’s economies was 0.36 and the unweighted average of non-LDC developing economies was 0.39. This corroborates the overall impression of LDC economies as less diversified than other countries, although a relative overreliance on a limited number of products need not be of immediate concern; after all, several of the richest LDCs are also among the least diversified ones. Yet a lack of diversification can hold back the building of productive capacities and, as a result, hamper development that is sustainable in the long term.

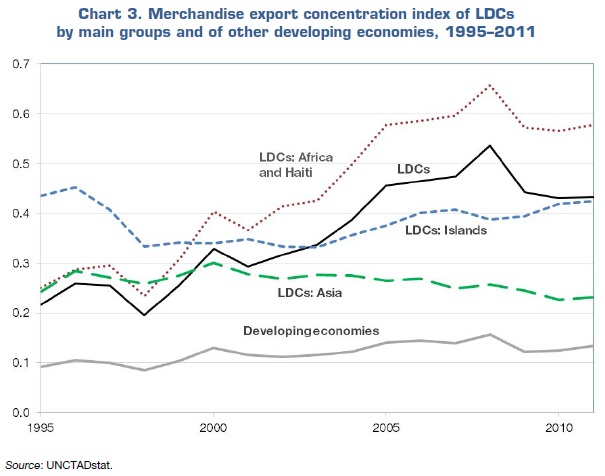
A worrying trend is that the diversification of LDC economies has narrowed over the years. Chart 3 depicts the evolution of the merchandise export concentration index since 1995 for LDCs as a whole, African LDCs and Haiti, Asian LDCs and island LDCs. It may be seen that the index value for LDCs as a group virtually doubled between 1995 and 2011 – from 0.22 to 0.43. It is also visually clear that this trend of a narrower export base stemmed from higher concentration levels in the group comprised of African LDCs and Haiti, where concentration surged from 0.25 in 1995 to 0.58 in 2011. The index values for Asian LDCs and island LDCs, meanwhile, remained fairly steady during the 17-year period.

Manufacturing
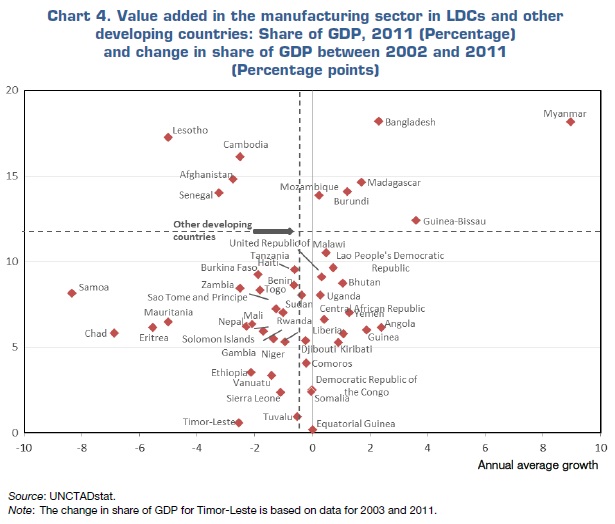
It is widely acknowledged that the expansion of the manufacturing sector may be a critical component of a country’s structural transformation and economic development. Although structural change can also take place through resources shifting to the services sector or to higher value added activities in the primary sector, manufactures is of special interest because of the employment the sector can generate, the higher productivity levels it can spur and the close linkages that may exist among subsectors. Chart 4 shows a mixed picture of how the role of manufactures changed in LDCs between 2002 and 2011. While over the past decade value added (see box below) in the manufacturing sector as a share of gross domestic product (GDP) decreased in 29 LDCs, it rose in 19 LDCs. Overall, the average share of manufacturing value added for all LDCs contracted by 0.7 percentage points and was primarily due to falling shares in African LDCs and island LDCs (-0.9 and -1.8 percentage points, respectively). The group comprising Asian LDCs, meanwhile, saw its average share of manufacturing value added widen by 0.9 percentage points.

The chart also shows how the changing shares of value added in the manufacturing sector in LDCs compare with the average share of non-LDC developing countries: 26 LDCs experienced a more positive change between 2002 and 2011 than this group of other developing countries, whose share narrowed by 0.8 percentage points. A similar picture emerges when comparing median values: the median change in LDCs was -0.6 percentage points, while the median change in other developing countries was -1.0 percentage points. Thus, although value added in the manufacturing sector contracted in most LDCs during the past decade, the majority of LDCs had higher increases (or lower decreases) than the average and median developing country.
The share of manufacturing value added to GDP is still low in LDCs, however. In 2011, only 10 LDCs had a share that was higher than the average 12 per cent of other developing countries. It is clear, therefore, that many LDCs are starting from a low base and that their manufactures output needs to expand significantly faster than that of other developing countries if they seek to emulate the value added shares exhibited by the latter group.
The challenge of determining value addition
The emphasis on value added in the manufacturing sector notwithstanding, the IPoA expressly includes goals to raise the value in other sectors as well. This is understandable, in that it recognizes that an allocation of resources to more productive activities can occur in all sectors and that countries differ in their comparative advantages. Unfortunately, determining where the activities in a given sector take place along a value chain is difficult because data is primarily available at more aggregate levels. The data can show how important a sector is for an economy – such as the contribution of extractive industries to resource-rich LDCs or the role of services in the economies of island LDCs – but often falls short when it comes to revealing the sophistication of that sector or how much of the value added stems from downstream activities.


