News
IMF regional consultation with the West African Economic and Monetary Union

On March 21, 2016, the Executive Board of the International Monetary Fund (IMF) concluded the annual Discussion on Common Policies of Member Countries of the West African Economic and Monetary Union (WAEMU).
Background
Despite the fragile security situation in some member countries and a less favorable external environment in 2015, economic growth exceeded 6 percent for the second consecutive year, driven by ongoing infrastructure investments, solid private consumption, and favorable agricultural campaigns. Inflation has remained subdued around 1 percent in 2015, reflecting the exchange rate anchor and positive terms of trade developments. Monetary policy has remained accommodative, with the key policy rate unchanged at 2.5 percent since September 2013, and private sector credit grew by nearly 14 percent in 2015.
The overall budget deficit (including grants) increased to 4.8 percent of GDP in 2014, up from 3.3 percent in 2013, largely driven by ongoing large public investment programs to address countries’ infrastructure gaps. This deterioration increases public debt for the region to 44.7 percent of GDP in 2015 from 38.9 percent in 2014.
The drop in oil prices has lightened the energy bills for all WAEMU countries while cocoa and groundnut prices have remained buoyant, thereby improving the trade balance, notably of Cote d’Ivoire, the largest economy in the region. However, the surge of imports associated with public investment and private consumption has partly offset the impact of lower energy bills. As a result, in 2015 the region’s overall current account deficit reached 5.6 percent of regional GDP, compared with 6.1 percent in previous year, and gross international reserves rose to 5 months of imports from 4.7 months in 2014.
The medium-term growth outlook remains positive but entails significant downside risks. Growth should remain above 6 percent, owing to continued strong domestic demand, while inflation is expected to remain subdued. The overall fiscal deficit should gradually decrease while total public debt is projected to stabilize at moderate levels (about 40 percent of GDP). In the short term, security risks remain high. In the medium term, weaker trading partner growth, tighter global financial conditions, sluggish implementation of structural reforms, and difficulties delivering on the planned fiscal consolidation could weaken growth prospects.
WAEMU: Staff report on common policies of member countries
The region continues to experience strong growth in 2015, and the immediate outlook is positive. Inflation is projected to remain low, reflecting the exchange rate peg and positive terms of trade developments. However, risks are on the downside. In the short term, security risks remain high. In the medium term, weaker trading partner growth, tighter global financial conditions, sluggish structural reforms, and difficulties delivering on the planned fiscal consolidation could weaken growth prospects.
Policy recommendations
The challenge is to sustain the growth momentum while preserving internal and external stability in an uncertain global landscape.
-
Fiscal policy. Pursuing fiscal consolidation while meeting development needs will require steadfast implementation of reforms to increase domestic revenue, rationalize current spending, improve public financial management, increase public investment efficiency and further strengthen debt management.
-
Monetary policy. Macroeconomic conditions do not warrant a tightening of monetary policy. Action is needed, however, to enhance monetary transmission mechanisms. This will require improving liquidity management, deepening financial markets, and strengthening market-based operations.
-
Financial sector. The authorities should pursue the reform agenda to strengthen risk-based supervision, align prudential limits with international standards and best practices, and avoid regulatory forbearance. Financial deepening will also be critical.
-
Competitiveness, diversification, and inclusion. Strong resolve is needed to move ahead with long-awaited structural reforms to boost competitiveness and diversification, improve the business environment and enhance inclusion
Recent economic developments
Growth remains robust and inflation subdued. While average economic growth in Sub-Saharan Africa has been slower than expected, reflecting weak commodity prices and difficult financing conditions, economic activity in the WAEMU remained strong. Regional real GDP growth is estimated to have reached 6.4 percent in 2015, driven by ongoing infrastructure investments, solid private consumption, and favorable agricultural campaigns. Inflation remained subdued reflecting the exchange rate anchor and positive terms of trade developments.
The fiscal deficit widened further. The overall fiscal deficit has largely been driven by ongoing large public investment programs. It is estimated to have reached 4.6 percent of GDP in 2015 up from 3.4 percent in 2014. This deterioration brings the regional deficit more than 2 percentage points higher than the average of the last 10 years.
The current account deficit remains large in spite of lower energy prices. The drop in oil prices has lightened the energy bills for all WAEMU countries while cocoa and groundnut prices have remained buoyant, thereby improving the trade balance, notably of Cote d’Ivoire, the largest economy in the region. However, the surge of imports, associated with public investment and private consumption has partly offset the impact of lower energy bills. Thus, the region’s overall current account deficit has improved somewhat from 6.1 to 5.6 percent of regional GDP. Gross international reserves (GIR) have slightly increased, supported by a stricter implementation of the obligation to repatriate export receipts. The net foreign asset (NFA) position of commercial banks, however, has continued to deteriorate. This appears to reflect commercial bank sales of foreign currency to meet client needs, exceeding corresponding purchases from WAEMU central banks or from exporters.
The external position is sustainable but vulnerabilities remain. Model-based assessments indicate that the current account and real effective exchange rate are broadly in line with fundamentals. Regional reserve coverage, even after assuming that BCEAO reserves would be used to replenish commercial banks’ NFA drawing, remains adequate – provided the current account deficit stabilizes over the medium term – according to traditional metrics and under the zone’s monetary arrangement with France.
Outlook and Risks
The outlook remains positive. Over the projection period, growth should remain above 6 percent, owing to continued strong domestic demand and stronger agricultural production. Meanwhile, inflation is expected to remain subdued over the medium term. The overall fiscal deficit should gradually decrease while total public debt is projected to stabilize at moderate levels (about 40 percent of GDP). The current account deficit (including grants) would stabilize slightly above 6 percent of GDP over the medium term because of fiscal consolidation and rising exports. FDI and capital transfers are expected to remain the main source of external financing. Reserve coverage would remain stable.
The outlook is subject to significant downside risks.
-
The projected economic growth assumes the realization of reforms to spur private investment. In particular, growth in most WAEMU countries anticipates progress in the efficiency of infrastructure investment, reforms of the energy sector, a more inclusive financial sector, and improvements in the business climate. If structural reforms fail to materialize, growth prospects could falter.
-
Fiscal consolidation is required to maintain macroeconomic stability and thus the sustainability of the currency peg.
-
Security-related risks remain high in several countries. Islamist groups remain active in Mali and Niger with potential spillovers to neighboring countries. Beyond the immediate human toll, security issues would affect economic activity, strain budgets and undermine foreign investment to the region.
-
On the external side, a further slowdown in global growth, and/or tighter global financial conditions, could affect macro-fiscal stability, foreign direct investment, and other external flows (Box 2). Lower cocoa and groundnut prices would also adversely affect exports. Overall, external growth shocks could reduce WAEMU growth by up to 1.5 percentage point.
Box 2. WAEMU: Risks for the Regional Economic Outlook
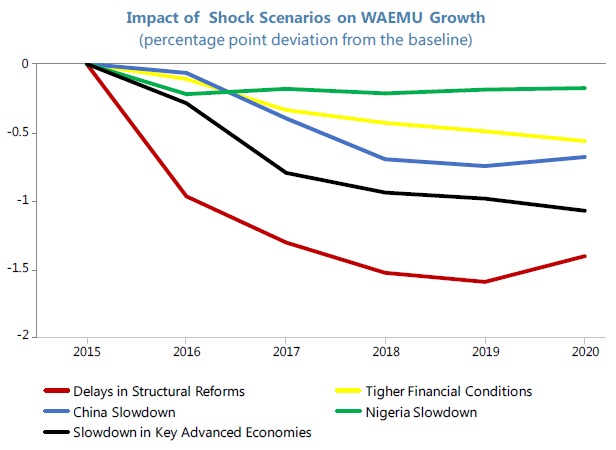
We estimate the possible effects of identified domestic and external downside risks on the WAEMU outlook (See companion Selected Issues Paper). First, we simulate the impact of (i) country-specific delays in structural reforms and (ii) tighter or more volatile global conditions which would result in higher financing costs for governments and (iii) we model the impact of a growth slowdown in key advanced economies, China, and Nigeria. Results show that the materialization of these risks would reduce real aggregate WAEMU GDP growth by up to 1.5 percentage points through different channels.
-
Delays in structural reforms. For most WAEMU countries, growth projections under the baseline scenario assume the realization of growth-enhancing structural reforms including improvements in PFM, better incentives for private sector activity, higher investment efficiency etc. Country assessments of a delay in those reforms show substantially lower domestic investment growth coupled with less external financing, reflecting mainly a significant reduction in private and foreign investment due to a less favorable business climate. This scenario would result in a lower WAEMU economic growth by about 1-1.5 percentage points compared to the baseline scenario.
-
Tighter global and, therefore, regional financing conditions in 2016-17. While regional exposure to global financial markets remains limited, increased financing costs could affect the region through higher regional risks premia and availability of external and regional financing. Overall, WAEMU growth could be reduced by about 0.6 percentage points compared to the baseline scenario, owing to lower private investment.
-
Lower growth in key advanced economies. Result show that a 1-percentage point lower growth in key advanced economies would reduce WAEMU real GDP by about 0.8 percent after two years and about 1 percent at the peak after five years.
-
Lower growth in China. A slowdown in China would directly affect regional exports and investment flows. WAEMU countries could also be affected through cross-border spillovers from the Euro area and other emerging market partners. A 1-percentage point lower growth in China would lower WAEMU real GDP by about 0.5 percent in the short term. It is worth noting that the effects of a lower growth in China have increased over time, and also become more heterogeneous across all countries. Finally, lower growth, driven by a slowdown in the manufacturing sector has significant spillover effects suggesting a potential important role of China rebalancing process on the region.
-
Lower growth in Nigeria. Spillovers from Nigeria are the lowest: a 1-percentage point lower growth in Nigeria would reduce WAEMU real GDP by only 0.2 percent after 3-4 years.
Aggregate numbers hide diverse situations across countries: the impact of shocks is larger in countries with higher trade openness (Benin, Senegal, and Burkina Faso) and benefitting from higher investment levels from China (Niger and Togo). Transit and informal trade are major spillover channels of regional shocks (Benin, Togo) while regional linkages increase through rapidly growing cross-border banks.
Selected Issues Paper
Public investment efficiency in WAEMU: An empirical assessment
WAEMU countries are projected to increase public investment volumes significantly to close the region’s infrastructure gap. This gap is relatively large and has been widely identified as a growth bottleneck. The WAEMU’s infrastructure needs are substantial. In particular, WAEMU countries are lagging behind sub-Saharan African benchmark countries in electricity supply, paved road density and telecommunication infrastructure. Insufficient or inefficient infrastructure reduces the return to trade and economic activity and constrains growth prospects. To close this gap, many WAEMU countries are envisioning to significantly boosting public capital expenditure in the medium-term. On average, staff projects that public capital expenditures will increase to around 9.5 percent of GDP in 2015 to 2019, up from an average below 8 percent in 2011-14.
In addition to the infrastructure gap, however, the region’s infrastructure is also perceived as being of relatively low quality, and investment efficiency appears low. The most recent World Economic Forum’s (WEF) Global Competitiveness Indicators ranks WAEMU countries 110 out of 148 countries, behind the sub-Saharan African average and sub-Saharan African benchmark countries. The quality of electricity supply, railroads and roads scored below sub-Saharan benchmark countries’ average as well. At a comparable level of real public capital stock, WAEMU’s overall infrastructure quality is perceived as lower than that of regional peers.
There is substantial room to improve public investment efficiency in WAEMU, in particular by improving the quality of institutions. The analysis finds that WAEMU’s public investment efficiency seems weak relative to that of the best performers in SSA, using efficiency frontiers. The regression analysis suggested that stronger institutions could reduce the public investment efficiency gap in WAEMU. WAEMU countries need to evaluate the strength of their PIM practices and identify country-specific PIM institutional priorities for reform. Improving public investment efficiency, in turn, could help boost growth and speed up progress in realizing the development agenda.
Fiscal space in WAEMU
The Need for Scaling Up
WAEMU countries need to mobilize substantial financial resources to address the infrastructure gap, which has been widely identified as a growth bottleneck. Many studies find that inadequate infrastructure impedes growth. Infrastructure development was estimated to have contributed about 1 percentage point to per-capita growth in West Africa in 2001-05. For Benin, Domínguez-Torres and Foster (2011) estimate that infrastructure contributed 1.6 percent points to per capita growth; while in Senegal, Torres, Briceño-Garmendia, and Dominguez (2011) find the contribution was about 1 percent point. Also, raising the two countries’ infrastructure endowment to that of Africa’s middle-income countries could boost annual growth by 3.2 and 2.7 percentage points respectively. Recent reports also confirmed a continued infrastructure bottleneck in other WAEMU countries.
To finance the scaling up of public investment while preserving macroeconomic stability, WAEMU countries have to use their fiscal space efficiently. While WAEMU countries’ external debt levels declined owing to the heavily indebted poor countries (HIPC) multilateral debt relief initiative, leaving some scope for external borrowing, the availability of financing at attractive terms is limited. Also, some countries’ total government debt has increased considerably since those countries received the debt relief, which suggests that caution is warranted in additional borrowing.
Therefore, it is essential for the sustainable financing of scaling up infrastructure investment that the two major channels for creating fiscal space be used. These channels are increasing tax revenue and increasing the efficiency of spending.
Raising Tax Revenue
Improving tax collection remains the main channel for enlarging the fiscal space. This has been well recognized in the WAEMU, which has a convergence criterion of 20 percent for the tax-to-GDP ratio, even though several member countries have not been in compliance with this criterion for years.
The WAEMU’s relatively high indirect tax rates have not resulted in higher tax collection. Indirect tax rates in the WAEMU are higher than the average rates in sub-Saharan Africa and in low-income countries, especially for goods and services taxes and trade taxes. However, higher rates have not generated higher revenues. Roughly, the tax-to-GDP ratio has been below the sub-Saharan Africa average throughout the observation period (2000 to 2011), and just broadly in line with the low-income countries average. Looking at the trend over time, the WAEMU’s tax-to-GDP ratio improved from 11.7 percent of GDP in 2000 to 14.7 percent of GDP in 2011, driven by a broad trend in all member countries except Côte d'Ivoire, where results were affected by internal conflicts. However, the size of improvements varied considerably among the countries. For instance, Benin’s total tax revenue increased by 2.1 percent percentage points, while Togo’s total tax revenue rose by 6.6 percent percentage points.
Looking at the performance tax by tax, the improvement in the WAEMU’s tax ratio is driven by higher collection from income tax and goods and services taxes, while trade revenues are broadly flat due to limited trade liberalization.
-
Trade taxes: In contrast with sub-Saharan African and low-income countries, where weighted average tariff rates declined, reflecting trade liberalization over the last decade, the WAEMU’s tariff rates dropped only marginally and the tax-to-GDP ratio has remained broadly stable over time. In the comparator groups, sub-Saharan Africa’s drop in trade tax revenues reflects the rate decline, while it seems that low-income countries were able to offset the rate decline by efficiency measures that allowed these countries to broadly preserve the trade- tax-to-GDP ratio.
-
Personal income taxes: The WAEMU increased the tax-to-GDP ratio from about 3 to close to 4 percent of GDP, but it remained below the ratios for low-income countries and subSaharan Africa.
-
Goods and services taxes: The francophone tradition of relying more on direct than on indirect taxation is reflected in the relatively higher rates. This translates into a higher level of tax revenues than is the case in comparator countries by around 0.6 to 0.8 percent of GDP. Also, the improvement in the WAEMU countries over the observation period was most pronounced in this tax category.
WAEMU countries show considerable variation in the drivers for revenue collection by tax categories. For example, in Togo, income tax revenue declined from 2.9 percent to 2.5 percent of GDP, but goods and service tax revenue rose sharply from 2 percent to 9.2 percent of GDP. In Benin, the revenue gain was driven by higher trade tax revenue, while goods and services tax revenue declined. In Cote d’Ivoire, however, the decline in tax revenue was mainly driven by falling trade tax revenues.
Our analysis suggests that WAEMU countries are ahead of comparator countries in their total tax collection, but have room to improve income tax collection. In 2011, total tax collection in the WAEMU exceeded the potential revenue by around 6 percent and 12 percent when compared with low-income countries and sub-Saharan African countries respectively. This shows an improvement compared to 2000 when the WAEMU’s total tax collection was below potential by around 4 percent compared with both low-income and sub-Saharan African countries. The following factors explain this trend:
-
Goods and services taxes: The relative improvement between 2000 and 2011 was mainly driven by a more positive goods and services tax gap. However, higher tax rates in the WAEMU explain at least part of this positive tax potential.
-
Trade taxes: Despite the higher average tariff, our tax potential analysis indicates only a moderately positive tax gap in 2011. However, improvements of the trade tax revenue compared 2000 range from below to slightly above potential for both benchmark groups.
-
Income taxes: Revenue performance as measured by the tax gap deteriorated from around - 1½ percent to around -5½ percent compared with the gap in sub-Saharan African countries, and closed only slightly from around -3½ percent to around -2 percent with respect to the low-income country benchmark.
WAEMU countries have substantial room to improve domestic tax collection. WAEMU countries have recently initiated reforms towards trade liberalization, most notably, the introduction of a common external tariff for all Economic Community of West African States countries in January 2015. While the implementation will be gradual, it is expected that trade revenues will decline. Therefore, it is important for the WAEMU to enhance its domestic tax revenue base, in particular, income tax revenues, where both analytical approaches indicate room for improvement by around 0.8 to 2 percent of GDP.
Improving spending efficiency
Is there scope for creating fiscal space by improving the efficiency of public spending? Our analysis focused on the technical efficiency of translating public spending into the corresponding results by comparing WAEMU’s input-output performance in public spending to those of other sub-Saharan African countries with similar levels of development. In addition, to reflect WAEMU countries’ aspirations to accelerate growth, specific comparisons with the fast-growing non-resource rich sub-Saharan African countries were provided. Quantitative assessments were conducted through a nonparametric data envelopment analysis (DEA). While public spending covers many sectors, only the education and health sectors were analyzed because these are sectors in which public spending plays a major role, and consistent cross-country data are readily available. Furthermore, based on data for 2008-12, we estimated the potential budgetary savings from higher efficiency in education and health to better inform policy discussions.
Financial stability, development and inclusion in the WAEMU
Based on most recent indicators of stability, deepening and inclusion, this paper provides comparative evidence of the situation of WAEMU in several areas of financial development relative to groups of benchmark countries. A regression of the volatility of growth on financial development highlights that the volatility of growth in the WAEMU over the last decades could have been substantially lower if financial development was at the levels of Asian or African benchmark groups.
While growth of credit to the economy is robust, there are significant gaps in the financial development in the region. Credit to the economy continues to grow robustly at around 15 percent year on year and the average WAEMU country’s credit to GDP level is in line with its macroeconomic fundamentals. However, the region is facing challenges in other dimensions of financial development. On the regulatory and financial stability side, prudential standards in WAEMU are weak by international standards and not well enforced. Indicators of financial inclusion have improved recently but are lagging behind both a group of African (Ghana, Kenya, Lesotho, Rwanda, Tanzania, Uganda, and Zambia) and Asian (Bangladesh, Cambodia, India, Laos, Nepal, and Vietnam) countries with whom the WAEMU shared similar levels of development in the 1990s but which have since then experienced faster growth.
As these benchmark countries have also experienced a decline in the volatility of growth over the same horizon, the question arises in how far this observed stability has been driven by developments in the financial sector. Growth in the WAEMU has been volatile, even when excluding large movements in real GDP per capita growth in Cote d’Ivoire due to episodes of political instability. As African and Asian benchmark countries which have on average succeeded to increase financial development more strongly, have also witnessed lower volatility of growth over the last decade, the question arises to what extent further financial development in the region could mitigate these growth swings. To answer this question, this note uses the recently developed index of financial development by Sahay and others (2015), and tests for its economic and statistic significance in a panel regression, together with standard determinants of growth volatility. The results suggest that difference in financial development in the WAEMU compared to the African and Asian benchmark countries can account for 10 percent of the difference in the volatility of growth between the WAEMU and these groups in the last decades. In addition, as pointed out by Sahay and others (2015), a more developed financial sector could also boost growth itself.
Developments in Banking and Financial Stability
The WAEMU’s banking sector has been growing at a steady pace over the last few years, with variations across member countries. This growth which averaged 15 percent a year reflects the continuing development of banking activities and products and their reach in the WAEMU area. It also underscores an increasing contribution to finance the economy. While credit to the private sector remains one of the main banking activities, banks sovereign exposures appear to be on the rise reaching more than 26 percent of total assets in 2015.
Developments in Financial Access
Access to financial services has increased in most WAMU countries but remains lower than in benchmark countries. Access to financial services, as measured by the share of the population with a bank account, has increased significantly in most WAMU countries from 2011 to 2014. The share of the population with an account has more than doubled in Senegal from almost 6 to almost 12 percent, and Niger from a low level of 1½ percent to almost 3½ percent. Benin, Togo, and Mali have seen increases of more than 50 percent in these shares. Moreover not all groups of the population have benefited equally from this increase in access. Financial access gaps across gender, age, education and income remain relatively high, and have even increased in some cases. The share of the population in possession of a debit or credit card also remains multiple times lower in WAEMU countries as compared to the benchmark groups.
Developments in Microfinance
While micro-finance activities have been steadily increasing in WAEMU, they are still low relative to those of the banking sector. There were around 724 Micro-finance Institutions (MFIs) at end June 2015. Their deposits and credit activities witnessed a steady average annual increase of 12.2% and 9.9% respectively. However, the size of these activities is still very low compared to banking sector. While microfinance institutions have been a strong tool to promote financial inclusion in WAEMU, they have posed some challenges, including weak credit management, poor governance, lacking information systems and internal controls, weak application of prudential rules, and existence of some MFIs without proper licenses. In order to address these issues, WAEMU authorities have proceeded to liquidation and license revocation of many MFIs and closure of a large number of unlicensed MFIs. Some of the solutions taken by WAEMU authorities were also to regroup some small MFIs into networks, ensure a close monitoring of problematic MFIs and place some of them (13 as of June 2015) under temporary administration. Moreover, the initiatives taken by the BCEAO to establish a regional financial inclusion strategy and the creation of a credit information reporting system for MFIs are also additional tools to enhance the stability of this system and allow it to play its intended role.
Composite Measure of Financial Development
A composite measure helps rank the WAEMU’s performance in terms of financial development across several dimensions. The new broad-based index of financial development by Svirydzenka (2016) and Sahay and others (2015) helps benchmarking the WAEMU against benchmark groups according to its financial institutions and markets. The composite measure of financial inclusion suggests that the WAEMU lags behind benchmark groups with respect to the development of financial institutions and markets. While the WAEMU’s level of financial development was similar to that of other regions in the 1980s and 1990s, it was outperformed, especially by the Asian benchmark group in the 2000s and today. While there is a significant difference between the WAEMU’s performance in financial institutions compared to the Asian benchmark, the difference is even larger for the financial markets index. In particular, the financial market development appears insignificant in most WAEMU countries, except for Cote d’Ivoire. However, these low levels are comparable to the group of African benchmark countries.
Financial Development and Volatility of Growth in the WAEMU
This section tries to assess how further financial development could contribute to reduce the volatility of growth in the WAEMU. Building on Sahay and others (2015), we regress rolling standard deviations of growth (five-year period ending in current year) on the financial development index and a set of controls – initial GDP per capita (PPP), trade and financial openness, energy exports in percent of GDP, the volatility of foreign growth, gross capital inflows to the region excluding the country in question, terms of trade changes, the polity index, transition and offshore center dummies, growth of GDP per capita and the government balance. The results suggest that higher financial development is associated with lower volatility of growth and the relationship is weakening at higher levels of financial development.
Income inequality, gender inequality, and growth in the WAEMU
There is robust evidence that higher income inequality can impede growth. Lower net income inequality has been associated with faster and more sustained economic growth in both advanced and developing countries. With imperfect credit markets, income inequality prevents an efficient allocation of resources by decreasing poorer households’ ability to make investments into human and physical capital. Higher income and wealth inequality can also lead to socio-political instability and poor governance, thus discouraging investment.
The evidence that gender inequality is impeding economic growth is also growing. Gender inequality has been associated with worse growth and development outcomes. Gender gaps in economic participation restrict the pool of talent in the labor market and can yield a less efficient allocation of resources, lower productivity and hence lower GDP growth. Since women are more likely than men to invest a large proportion of their household income in the education of their children, higher economic participation levels and earnings by women translate into higher expenditure on school enrollment for children. IMF (2015) highlights reductions in gender inequality as one of the most promising avenues to boost growth in the region – together with closing gaps in infrastructure and education. It shows that decreasing income and gender inequality in sub-Saharan African countries to levels observed in the ASEAN 5 (Indonesia, Malaysia, the Philippines, Thailand and Vietnam) could increase real GDP per capita growth by about 1 percentage point on average.
This paper has shown that both lower income inequality and lower gender inequality could boost real GDP per capita growth in the WAEMU, in addition to previously identified policies. The results emphasize that gender inequality of outcomes and opportunities is very high, and policies to mitigate these inequality are particularly promising. In particular, closing gender gaps in education would not only stimulate growth from a more efficient allocation of resources, it would in addition increase total education in the region, thus boosting growth further. Lower gender inequality has also been associated with a more equal income distribution which in turn is also associated with higher growth. This note confirms previous findings that the region could benefit from boosting infrastructure and human capital and strengthening of institutions.
The following policies could help reduce income inequality and gender inequality:
-
Remove legal inequalities between men and women. For example, Namibia equalized property rights for married women and granted women the right to sign a contract, head a household, pursue a profession, open a bank account, and initiate legal proceedings without the husband’s permission in 1996. In the decade that followed, Namibia experienced a 10 percentage point increase in its female labor force participation rate. Lower gender gaps in female labor force participation, in turn, have also been associated with lower income inequality.
-
Foster education. This could not only increase productivity through a more efficient allocation of resources but in addition boost overall education levels, a pre-requisite for sustained growth.
-
Boost infrastructure, including through improving access to water and increased electrification of the region. This could not only boost growth directly but in addition free women’s time to go to school and join the labor market since girls and women are most cases the main providers of household work.
-
Reduce the regressivity of fiscal spending and taxes. In particular, replace across-the-board subsidies with well-target social transfer schemes.
-
Foster financial inclusion, including for women (see SIP on financial inclusion and stability)
In promoting policies to reduce gender and income inequality, this paper does note pose any normative judgment on countries social and religious norms but argues for a level playing field, for all agents in the economy being able to explore their economic potential – if they so choose.
Assessing risks for WAEMU economic outlook
Risks to the regional outlook are skewed to the downside. As shown in the 2016 WAEMU Staff Report on Common Policies of Member Countries, the outlook for the region is positive but with downside risks. On the domestic side, delays in implementing structural reform may lower regional growth prospects. The positive outlook of the baseline scenario assumes, indeed, timely and effective implementation of several domestic reforms such as (i) enhancing the efficiency of spending and improving the quality of public investment; (ii) creating additional fiscal space to meet development needs while safeguarding macroeconomic stability and debt sustainability; (iii) increasing financial access and inclusion while preserving financial stability; and (iv) boosting competitiveness and diversification, improving the business environment and enhancing inclusion. On the external side, the growth slowdown in China or tighter or more volatile global conditions would also affect WAEMU members. While regional exposure to global financial markets remains limited, increased financing costs could influence the region through higher regional risks premia and availability of external and regional financing. A sharper-than-expected slowdown in China would directly affect regional exports and investment, flows. WAEMU countries could also be affected by cross-border spillovers from the Euro area and other emerging market partners.
Country-specific simulations indicate that delays in structural reforms would lower WAEMU economic growth by 1-1.5 percentage points compared to the baseline scenario. The domestic risk scenario assumes a delay in key reforms at each individual country level (and at the regional) level. These reforms can be related to fiscal consolidation, improvement in public finance management, infrastructure investment, the energy sector, the financial sector, or business climate. As these reforms are already – to the certain point – integrated in the countries’ baseline projections, their delay has an immediate impact on the consolidated WAEMU economic performance. Assuming inertia in structural reforms, domestic investment growth would be lower by about 2.5-3 percentage points compared to the baseline, reflecting mainly a significant reduction in private investment due to a less favorable business climate than assumed in the baseline scenario. Domestic consumption growth is projected to be lower by about 1.2 percentage points compared to the baseline. Lower domestic demand is expected to immediately reduce imports while export growth would decline more gradually reflecting lower competitiveness of the region. The current account balance (excluding grants) is projected to improve by about 0.5 percentage point of GDP, on average. The overall fiscal balance (excluding grants) is expected to improve by about 0.6 and 0.2 percentage point of GDP in 2016 and 2017, respectively, due to lower public investment. However, with falling fiscal revenue, the overall fiscal balance would deteriorate by about 0.1 percentage point of GDP over the medium term. Delays in structural reforms would put strains on external financing; lowering substantially current transfers and official loans up to about one percentage point of GDP in favor of more short-term portfolio inflows. This scenario would result in a small cumulative reduction in WAEMU official reserves of about US$ 0.2 billion.
Simulations show that tighter global conditions in 2016-17 would affect WAEMU growth mainly through lower investment. A global financial volatility scenario assumes a reassessment by investors of underlying risks and a disorderly overshooting in the normalization of risk premia across the globe, leading to higher corporate default rates, heightened money market spreads, and depressed consumer and investor demand throughout the world. Under this scenario, lower risk appetite among investors reduces the availability of both external financing and capital inflows to the region by about one percentage point compared to the baseline. While regional exposure to global financial markets remains limited, increased financing costs impacts financing at the regional sovereign bond market. Initially, the governments are expected to maintain investment efforts and face higher debt service, which would contribute to an increase in the overall fiscal deficit. Private investment growth on the other hand is projected to slow down by about 0.5 percentage point, on average, compared to the baseline. Over the medium term, as external financing for the region is expected to resume slowly, more costly regional financing would lead to lower public investment growth by about 0.8 percentage point compared to the baseline. Overall, this scenario would reduce WAEMU growth by about 0.6 percentage points, on average.
Global and regional growth shocks will impact economic growth in WAEMU countries. We model the impact of lower growth in key economic partners of the region:
-
Lower growth in key advanced economies. Result show that a 1-percentage point lower growth in key advanced economies would reduce WAEMU real GDP by about 0.8 percent after two years and about 1 percent at the peak after five years.
-
Lower growth in China. A slowdown in China would directly affect regional exports and investment flows. WAEMU countries could also be affected through cross-border spillovers from the Euro area and other emerging market partners. A 1-percentage point lower growth in China is estimated to lower WAEMU real GDP by about 0.5 percent in the short term. It is worth noting that the effects of a lower growth in China have increased over time, and also become more heterogeneous across all countries. Finally, lower growth, driven by a slowdown in the manufacturing sector has significant spillover effects suggesting a potential important role of China rebalancing process on the region.
-
Lower growth in Nigeria. A 1-percentage point lower growth in Nigeria would reduce WAEMU real GDP by 0.2 percent after 3-4 years.
Spillover effects become more important with the strengthening of trade and financial linkages. The above results suggest that the impact of growth shocks in China and Nigeria is larger in countries with higher trade openness, less diversified export structure, and with larger investment from China. For instance, a 1-percent point lower growth in China reduces real GDP by 1.2 percent at the peak in countries with more trade openness as Benin, Senegal, and Burkina Faso compared to 0.4 percent for less open economies. The results also indicate that a lower growth in China reduces real GDP by 1.2 percent in WAEMU countries where Chinese investment has been above the regional average, such as Niger and Togo. However, spillover effects are smaller for countries with a more diversified export structure as Cote d’Ivoire and Senegal. Cross-border banking groups – with ten pan-African banks already present in the SSA region and, at least, three in the WAEMU and neighboring Nigeria – constitute another rapidly developing shock propagation channel.


