News
The Nigerian economy: Past, present and future

This report is an analysis of the Nigerian economy over the 2010 through 2015 periods with particular focus on the nation’s Gross Domestic Product, Inflation, and Merchandise Trade Statistics. The report also includes forecasts for the aforementioned variables over the 2016-2019 period.
The demand for statistics at all levels of government; federal, state and local continues to grow exponentially, and with it, the analysis of the aforementioned data into concrete trends on various socioeconomic issues. In line with our mandate of the 2007 Statistical Act as the national statistical office, and the custodian of official statistics in Nigeria, National Bureau of Statistics (NBS) continues to strive for improvements in the delivery of its mandate which includes data production, coordinating the National Statistical System (NSS), advising the Federal, States and Local Governments on matters relating to statistical developments, as well as developing and promoting the use of statistical standards and appropriate methodologies.
The Nigerian Economy; Past, Present and Future is the fourth edition of Macroeconomic forecasts being published at the NBS and aims to provide policy-makers, researchers, investors and the general public of its assessment of the Nigerian economy in the past years, the likely trends of key macroeconomic indicators in the current year and future years. Similar to previous editions published by the NBS, the focus of this report continues to be macroeconomic statistics including GDP, Inflation, and Merchandise Trade; key macroeconomic indices followed by policy makers and analysts.
This edition differs from previous editions, however, as we have decided to provide more historical analysis over the previous five year period (since 2010) before analysis on recent economic developments and projecting. Again, the report combines an analysis of economic developments in 2015 with quantitative inputs into a Bayesian Vector Autoregressive Model (BVAR) modelled with parameters to represent a small open economy in order to arrive at reasonable forecasts of the levels and growth of the aforementioned macroeconomic variables.
Executive Summary
The turmoil in global commodity markets, witnessed in the second half of 2014 brought their full weight to bear on the Nigerian economy in 2015. Oil prices fell 66.8% from $114/barrel recorded in June 2014, to $38.0 by December 2015. Prices fell even further in 2016, to $32.6 as at 3rd February, 2016. Beyond commodity markets, recent developments in the global economy created a trifecta of headwinds that the nation has to contend with.
The return of Iran to the global economy implies substantially larger crude oil supplies are to hit the global market in the near term, and thus the current consensus that oil prices are likely to remain “lower of longer”. The issue of lower commodity prices has been further compounded by the United States Federal Reserve (FED) raising key interest rates, after several years of a very accommodative monetary policy as a result of the global recession which began circa 2008. In December 2015, the FED raised the Federal Funds Rate by a quarter-point. Furthermore, the economy of the Euro Area, a key importer of Nigerian exports is still on the mend. According to recent statistics from the European Commission 1 the Euro Area is expected to grow by 2.0% in 2016, up from 1.9% in 2015.
Interestingly, economists love these times, and thus the phrase; “never let a crisis go to waste”. Few instances give governments the opportunity to take hard decisions. Accordingly, the government is using the 2016 budget as an opportunity to reset and redirect the macroeconomic dynamics of the country. The attempt to consolidate expenditure using the Treasury Single Account to plug leakages (even if this is only at the federal level) is a welcome first step. The proposed 1.6 trillion to be invested in capital projects, and other initiatives in particular in Power, Works and Housing are likely to bode well for the economy. In addition, the establishment of the Efficiency Unit to identify and surgically eliminate inefficiencies without hampering productivity is also another development.
In the near term, the reset may not yield fruits as quickly as Nigerians expect. Economic growth in 2016 is expected to increase to 3.78% from 2.97% in 2015, an increase of less than 100 basis points.
Beyond 2016 however, growth is expected to jumpstart averaging 5.41% yearly between 2017 and 2019 as infrastructure developments take shape and provide support for both the oil and non-oil sectors. While upward pressure on inflation is expected, meaning that the Headline index may rise from 9.55% to 10.16% in 2016, rates are expected to moderate beyond this period and average 9.01% between 2017 and 2019. The value of total trade is expected to slow in 2016, increasing by 2.41% as a result of moderations in imports and exports. Beyond 2016, both import and exports are expected to increase and Total Merchandise trade is expected to Average 15.61% growth during the period.
Statistics on Imports and Exports of Merchandise
Exports
The value of exports fell in every quarter of 2015, resulting in an overall decline over the first three quarters of 21.03%. In the first quarter, the value declined by 9.80% from the Fourth Quarter of 2015 to N 2,665.06 billion. In the second quarter the fall was more modest, the value declined by only 0.42% to N 2,653.79. The third quarter however saw the largest drop of 12.08%, meaning that the value of exports was N 2,333.21 billion in the last quarter for which data is available. In total, the value of exports for the first three quarters together was N 7,652.06 billion, which represents a decline of 42.68% relative to the same period of the previous year.
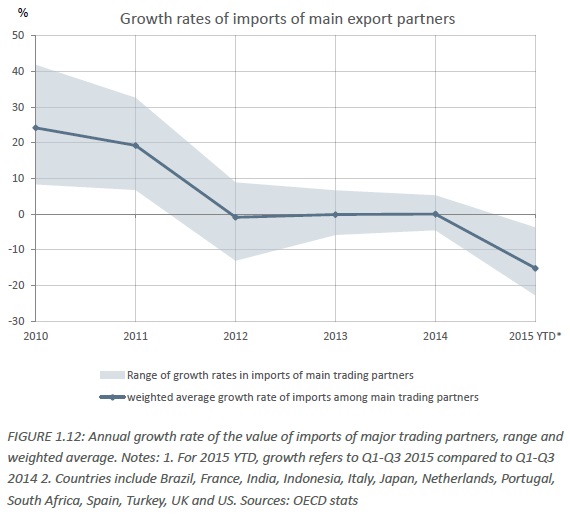
This fall in the value of exports can be viewed as part of a wider, global trend. Figure 1.12 shows the range of growth rates in the value of total imports for Nigeria’s main trading partners. The numbers refer to imports from all countries, not solely those from Nigeria. It also shows the average of these growth rates, weighted by how important each country is to Nigeria as an export destination. It reveals that average growth in import demand in these countries fell between 2009 and 2012, then remained stable until 2014, but then declined suddenly in the first three quarters of 2015, by 15.19% on average. The countries included account for 77.04% of Nigeria’s exports in 2014.
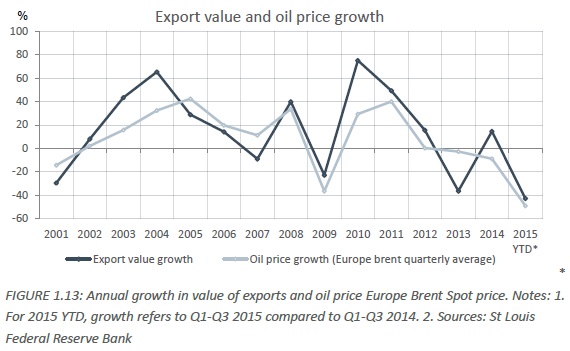
Overall, the value of global trade fell over the first three quarters of 2015 by 30.16%3 , which was to a large extent a result of falling commodity prices, such as crude oil. Whilst these trends affected all countries, they had a particularly large impact on Nigeria’s exports due to the heavy reliance on crude oil exports. Figure 1.13 plots the yearly growth in the value of exports against the growth in the oil price, from 2001 to 2015 Q1-Q3. Although there have been periods of divergence, the two series have moved together closely over the period, emphasizing the extent to which Nigeria’s exports are affected by changes in the oil price.
This trend continued into 2015. Over the first three quarters the price of oil fell by 24.2%, and the value of exports fell by 21.03%, or N 621.35 billion. However oil exports fell by an even larger amount over the period, by N 627.99 billion, which implies that non-oil exports increased over this period. Exports of Vehicles, aircrafts and parts thereof increased significantly, accounting for the 0.93% increase in non-oil exports. Between 2014 Q4 and 2015 Q3 the value of exports in this section increased by N 124.12 billion.
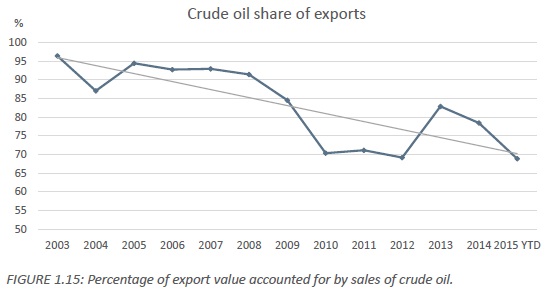
Although still dependent on oil, Nigeria is beginning to diversify its exports, albeit gradually. Figure 1.15 shows the percentage of the value of total Nigerian exports that is accounted for by crude oil. In 2003, 96.40% of the value of exported goods was accounted for by oil, and this figure fell to 78.45% in 2014. This is despite the increase in the oil price over this period. Over the first three quarters of 2015 the share of oil in exports fell further, to 68.88%. However this is perhaps less surprising given the dramatic fall in the oil price.
By continent, Europe remained the largest consumer of Nigerian exports, and accounted for 39.22%, or N 3,001.14 billion of the total value of exports in the first three quarters of 2015. Asia was the second largest consumer, and accounted for N 2,269.17 billion or 29.65%, followed by Africa (N 1,166.88 billion or 15.25%) and then The Americas (N 1,028.42 billion or 13.44%). It is notable that The Americas, which used to be second only to Europe as a consumer of Nigerian products, has slipped to fourth place. This is largely a result of the large decline in the value of exports destined for the US. In 2010, 34.37%, or more than one third of the value of exports was accounted for by the US. However, this figure has fallen consistently, and in the first three quarters of 2015, only 3.21% of exports went to the US. To a large extent, this can attributed to the discovery of large deposits of shale gas in the US, which reduced their dependence on imported crude oil.
Whilst exports to the US have fallen dramatically, they have been steadily increasing in value for India, the Netherlands and Spain, countries which accounted for 16.76%, 12.14% and 8.89% of exports respectively in the first three quarters of 2015.
Imports
The value of imports followed a clear downward trend in throughout the first three quarters of 2015. The largest fall was seen in the first quarter, when imports declined by 14.94% relative to the Fourth Quarter of 2014. However this continued into the second and third quarters, when the value of imports declined by 1.27% and 1.02% respectively. In total, the value of imports in the first three quarters of 2015 was N 5,121.58 billion, which represents a 4.15% decline relative to the same period of 2014.
A number of factors may have had a downward impact upon the value of Nigeria’s imports in 2015. Since the final quarter of 2014, the Naira has depreciated sharply. The Bureau de Change rate to the dollar was 168.90 Naira in 2014 Q3, compared with 225.49 in 2015 Q34. Whilst in the short term this has the effect of raising the value of imports, over time it may mean that as foreign goods become more expensive for domestic consumers, there is a substitution to local goods. In addition, a number of policy measures have been introduced which been aimed at regulating imports. Notably, CBN issued a circular detailing that importers would not be granted foreign exchange for a list of 41 items, making it more difficult to import them. In addition, the National Automobile Policy, which increased tariffs on imported vehicles was implemented in 2015.
Figure 1.17 shows how each section has contributed to the fall in the value of imports. The section to have contributed most is Vehicles, aircrafts and parts thereof, which fell from N 185.95 billion to N 149.09 billion over the year to 2015 Q3, contributing 2.02 percentage points, or just over a quarter of the fall. This section was particularly affected by policy, given both the National Automobile Policy, and the inclusion of Private Jets in the list of goods not eligible for foreign exchange. The section Base Metals and articles of base metals contributed a similar amount, falling from N 178.73 billion to N 142.15 billion, contributing 2.01 percentage points.
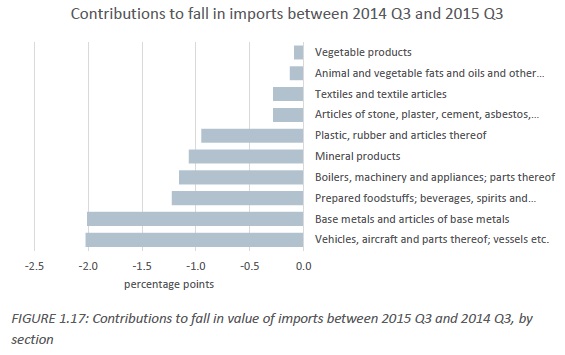
The third largest contributor to the fall was “Prepared foodstuffs; beverages, spirits and vinegars etc.” which contributed 1.22 percentage points. Looking at the share of overall import value accounted for by key sections since 2010, several trends emerge; the share of Vehicles, Aircrafts and Parts Thereof in total imports has on average been falling since 2010, although the series is volatile. Whereas in 2010 this section accounted for 22.18% of the value of imports, it had fallen to 8.97% in the first three quarters of 2015. Its lowest share was seen in 2013, when it only accounted for 8.86%. The share of “Prepared foodstuffs and beverages” has also been declining in recent years, and at 5.05%, is now at its lowest since 2010. By contrast, the share of Mineral Products has increased markedly, from only 2.67% in 2010 to 18.67% in the first three quarters of 2015, although these series are volatile, Just as trade statistics generarlly are.
By content of origin, Nigeria imported N 2,157.65 billion from Asia over the first three quarters of 2015, making it the most important region for imports over this period and accounting for 42.13% of total imports. Europe was the second most important, accounting for 38.34% of the total, followed by The Americas (N 660.15 billion or 12.89%) and Africa (N 280.98 billion 5.49%), and Oceania was the least important, and accounted for only N 58.94 billion, or 1.15% of the total.
This represents the continuation of a trend that has been seen since 2010, in which Europe and Asia have been increasing in importance as import partners, and The Americas has been supplying less products consumed in Nigeria. In 2010, The Americas was the second largest supplier and accounted for 29.97% of total imports; this figure had fallen to 12.89% by the first three quarters of 2015, and had been overtaken by Europe, whose share had risen from 24.35% to 38.34% over the same period. Asia increased its dominance slightly over the period; its share rose from 37.55% to 42.13%.
Most of the decline in trade with The Americas was due to the US, which accounted for 8.38% of imports in the first three quarters of 2015, down from 17.94% in 2010. In contrast, the rise in the value of goods imported from Europe was more wide spread, with a number of countries contributing to the increase. The most notable increases were the Netherlands, whose share of imports rose from 0.79% to 6.46% over this period, and Belgium, whose share increased from 3.86% to 7.70%. Over this period, China’s share rose from 16.56% to 22.81%, which is more than the sum of the next three largest import partners combined, emphasizing China’s importance as a supplier of products.
The share of trade with both the Netherlands and Belgium may be slightly misleading as a result of what is sometimes referred to as the “Rotterdam” effect. It is an international convention that trade is recorded as being with whichever country owns the “first port of unloading” (in the case of exports) or the” last port of unloading” (in the case of imports). This means that if goods pass through a country before arriving at their final destination, then trade will be recorded as being with the intermediate country. This is frequently the case with the Netherlands and Belgium, as the ports in Rotterdam and Antwerp are two of the biggest in the world, and a high volume of trade passes through them.
Total Trade
In the first three quarters of 2015, the decline in the total value of trade that began in 2014 Q2 continued; growth has been negative in every quarter since that period. As a result, the sum of total trade over the first three quarters of 2015 was N 12,773.84 billion, 31.67% lower than the same period of 2014 when total trade was N 18,692.82 billion.
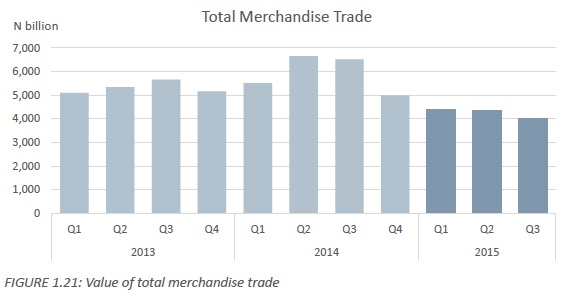
The largest quarterly decline was seen in the first quarter of the year, when the value of total trade was N 4,392.74 billion or 11.89% lower than in the preceding quarter. The second quarter was comparatively stable, falling only by 0.76% to N 4,359.47 billion, but the third quarter saw a larger fall of 7.75%, which resulted in a value of total trade of N 4,021.44 billion in the third quarter, 38.31% lower than in the third quarter of 2014.


