News
FDI continues to rise in the first half of 2015

Global FDI flows picked up in the first half of 2015, increasing by 13% compared to the second half of 2014. If we exclude the drop in the first half of 2014, global flows have been on a rising trend since the first half of 2013.
In the first half of 2015 global FDI flows increased by 13% compared to the second half of 2014, to USD 883 billion. If we exclude the drop observed in the first half of 2014 due to Verizon buying out Vodafone’s investment in its US operations which reduced both inward investment in the United States and outward investment from the United Kingdom, global FDI flows have been on a rising trend since the first half of 2013. However, the increase observed in the first half of 2015 is largely due to FDI inflows to the United States and to Hong Kong, China hitting record-levels.
Press reports noted a number of United States corporations announcing that they intend to be involved in cross-border M&A deals that would reduce US their tax obligations, showing that the increase in inward investment in the United States is not just related to improving economic performance there. Figure 1 shows global FDI flows from Q1 2013 to Q2 2015. The measure was constructed using FDI statistics on a directional basis whenever available, supplemented by measures on an asset/liability basis when needed.
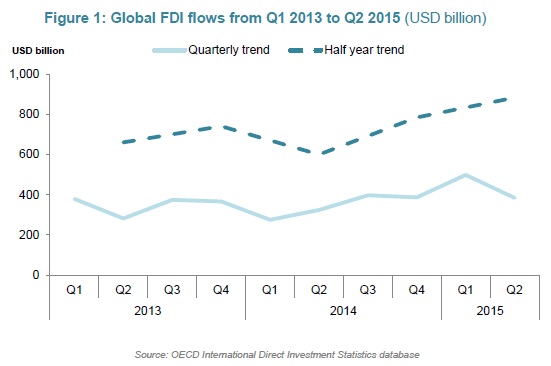
The analysis of trends for global FDI flows on a quarterly basis is not easy due to the high volatility of the flows which are often very much affected by a few very large deals which occurred during a specific quarter. Looking at FDI flows for each half year seems to offer more visibility on the trends: if we exclude the drop in the first half of 2014 due to the Vodafone Verizon deal, global flows have been on a rising trend since the first half of 2013, and remained above USD 300 billion in each quarter. Global FDI flows increased by 29% in the first quarter of 2015 as compared to the previous quarter, from USD 387 billion to USD 499 billion, due to inward FDI flows to the United States hitting a recordlevel (at USD 200 billion) and due to Hong Kong, China’s net incurrence of FDI liabilities of USD 71 billion. For Hong Kong, China the first half of 2015 (at USD 131 billion) exceeds annual levels recorded during the period 2005-2014. Global FDI flows decreased in the second quarter by 23% to USD 384 billion, a level which remains comparable to the last quarter of 2014. Global FDI flows would remain below the peak reached in 2007 even if the rapid pace of the 1st half of 2015 was maintained in the 2nd half of 2015.
In the first half of 2015, FDI flows into the OECD area increased by 50% as compared to the second half of 2014, from USD 375 billion to USD 564 billion, and FDI outflows were up 10% from USD 526 billion to USD 581 billion. FDI inflows to the OECD area accounted for around 55% of global FDI inflows, as compared to an average 45% in 2013 and 2014. FDI inflows received by the United States in the first quarter largely accounted for the increased share of the OECD as compared to the rest of the world. OECD FDI outflows accounted for around 75% of global FDI outflows, slightly higher than the average 70% in 2013-2014. This development was largely driven by high levels of FDI outflows from Ireland recorded in the first quarter of 2015 and to net disinvestments (negative outflows) from Hong-Kong, China in the second quarter of 2015 which reduced FDI outflows from the rest of the world. FDI flows into EU countries increased by 30% (from USD 136 billion to USD 177 billion) and outflows increased by 9% (from USD 205 billion to USD 224 billion); however, these levels remain below levels reached before the financial crisis. FDI inflows to the G20 as a whole increased by 18% from USD 530 billion to USD 624 billion but the situation varies across G20 OECD and non OECD sub-groups: FDI flows to OECD-G20 economies increased by 49% but were offset by a 15% drop in FDI inflows received by the non-OECD G20 economies. FDI outflows for the G20 decreased by 17% to USD 441 billion with G20 sub-groups showing similar declines.
OECD FDI inflows more than doubled in the first quarter of 2015 (to USD 368 billion) as compared to the previous quarter, then dropped by 47% in the second quarter (to USD 196 billion) but still remained above their levels observed in all quarters of 2013 and 2014 (except Q3 2014). Overall, they increased more than 50% in the first half of 2015 compared to the second half of 2014.
This development was largely due to record levels of FDI inflows in the United States in the first quarter of 2015 (USD 200 billion), of which USD 86 billion was in the chemical sector and USD 81 billion was in the ‘other manufacturing sector’. There were some large deals that could explain these inflows. 77% of the funds received by the United States came from Luxembourg: they were likely passed through Luxembourg SPEs before reaching the United States, and it is therefore difficult to identify the real sources of the funds. FDI inflows received by France and Germany recovered from net disinvestments observed in the second half of 2014 (to USD 13 billion and USD 3 billion respectively), and FDI flows in the Netherlands almost tripled (to USD 30 billion excluding flows received by SPE). FDI flows received by other major OECD recipients remained stable in the first half of 2015: the United Kingdom at around USD 40 billion, Australia at around 24 billion and Ireland at around 23 billion. In contrast, Canada received USD 24 billion as compared to USD 33 billion.
Within 17 economies as a whole who reported FDI instruments for the first half of 2015: total equity inflows and intercompany debt flows more than doubled, representing respectively 64% and 12% of total flows received by those economies, while reinvestment of earnings decreased by 11%, accounting for 23% of the total. The increase in equity capital was due to its role in the large M&A deals in the first half of 2015. However, the situation varies across countries. The increase of FDI equity flows was largely due to equity transactions in the United States which almost tripled (from USD 55 billion to USD 170 billion) and was slightly offset by decreases in Germany (from USD 20 billion to USD 7 billion). Intercompany debt inflows were boosted by increases in the United States (from USD 42 billion to USD 54 billion) but also in France and Germany where debt inflows were up from USD -8 billion and USD -26 billion respectively to USD 0.3 billion and USD -11 billion. Reinvestment of earnings went down driven by decreases in the United States (from USD 50 billion to USD 43 billion).
In the non-OECD G20 countries, FDI inflows declined in the first half of 2015 by 12% in China after very high levels at the end of 2014 (from USD 165 billion to USD 145 billion), by almost 40% in Brazil as the country officially entered a recession (from USD 51 billion to USD 31 billion), by 30% in Indonesia (from USD 13 billion to USD 9 billion) and by 36% in Argentina (from USD 4.6 billion to USD 3 billion). FDI flows received by India increased by 36% (from USD 16 billion to USD 22 billion) and almost tripled in Russia from very low levels in the second half of 2014 (from USD 4.7 billion to USD 12 billion). South Africa recorded negative FDI inflows (USD -1.4 billion).
FDI outflows from the OECD area increased by 10% in the first half of 2015 as compared to the second half of 2014 but the situation varies across countries. FDI outflows from Ireland more than doubled to USD 75 billion, of which USD 51 billion was equity capital recorded in the first quarter, mostly in the pharmaceutical sector. Outward FDI flows from the Netherlands, excluding resident SPEs, and net acquisition of FDI assets by Spain more than doubled: from USD 13 billion to USD 25 billion and from USD 14 billion to USD 30 billion respectively. FDI outflows from Canada, France, as well as net acquisition of FDI assets of Japan remained stable at around USD 43 billion, USD 24 billion and USD 62 billion respectively. Those developments were offset by decreases in outward investments from other major OECD investors: FDI outflows from the United States decreased from USD 192 billion to USD 177 billion; FDI outflows from Germany decreased from USD 59 billion to USD 35 billion. The United Kingdom recorded net disinvestments of USD -32 billion.
Within 17 economies as a whole who reported FDI instruments for the first half of 2015, total equity outflows increased by 17%, accounting for one third of the total outflows, while reinvestment of earnings remained stable (accounting for 55% of the total) and intercompany debt flows decreased (1% of the total). The increase in equity capital flows was largely due to its role in the large M&A deals in the first half of the year. As for FDI inflows, the situation varies across countries. The increase in FDI equity outflows was driven by increases from Ireland where equity outflows tripled (from USD 17 billion to USD 51 billion), and to a lesser extent from France where equity outflows also tripled from USD 4 billion to USD 13 billion. Those developments were partly offset by decreases recorded from the United States (from USD 37 billion to USD 9 billion). Reinvestment of earnings remained stable: they were slightly up in the United States, Germany and Sweden, but dropped in the other economies. The drop in intercompany debt flows was driven by negative intercompany debt outflows from Germany (at USD -7 billion as compared to USD 21 billion in the second half of 2014) and by decreases from France (from USD 15 billion to USD 5 billion) and Ireland (from USD 7 billion to USD 0.3 billion).
In the non-OECD G20 economies, FDI outflows of Argentina reached USD 2.8 billion of which USD 2.5 billion was recorded in the second quarter of 2015, which exceeds annual levels recorded during the period 2005-2014. FDI outflows of Brazil and China increased by 11% and 7% respectively (from USD 9 billion to USD 11 billion and from USD 49 billion to USD 53 billion), and FDI outflows of India doubled (from USD 0.9 billion to USD 2 billion). Those developments were offset by large decreases of FDI outflows from Russia (from USD 34 billion to USD 18 billion) and to a lesser extent from Indonesia (from USD 3.8 billion to USD 3 billion) and from South Africa (from USD 4.9 billion to USD 0.9 billion).
Due to the record levels of FDI flows received by the United States in the first quarter of 2015, they are the largest recipient of FDI inflows worldwide in the first half of 2015, followed by China (the largest recipient of FDI worldwide in 2010-2014), the United Kingdom and Brazil. The United States remained by far the largest source of FDI worldwide, followed by Ireland, Japan, China, Canada and Germany.


