News
Global Hunger Index: Over 45 countries on pace for “moderate” to “alarming” hunger levels by 2030 UN deadline

The global community is not on course to end hunger by the United Nations Sustainable Development Goal deadline of 2030, according to data from the 2016 Global Hunger Index. If hunger declines at the same rate as the report finds it has since 1992, more than 45 countries – including India, Pakistan, Haiti, Yemen, and Afghanistan – will still have “moderate” to “alarming” hunger scores in the year 2030, far short of the goal to end hunger by that year.
“Simply put, countries must accelerate the pace at which they are reducing hunger or we will fail to achieve the second Sustainable Development Goal,” said IFPRI Director General Shenggen Fan. “Ending global hunger is certainly possible, but it’s up to all of us that we set the priorities right to ensure that governments, the private sector and civil society devote the time and resources necessary to meet this important goal.”
The Central African Republic, Chad, and Zambia had the highest levels of hunger in the report. Seven countries had “alarming” levels of hunger, while 43 countries – including high-population countries like India, Nigeria, and Indonesia – had “serious” hunger levels.
The report outlined some bright spots in the fight to end world hunger. The level of hunger in developing countries as measured by the Global Hunger Index has fallen by 29 percent since 2000. Twenty countries, including Rwanda, Cambodia, and Myanmar, have all reduced their GHI scores by over 50 percent each since 2000. And for the second year in a row, no developing countries for which data was available were in the “extremely alarming” category.
But declines in average hunger levels across regions or individual countries do not tell the whole story. The averages can mask lagging areas where millions are still hungry, demonstrating the need for data and targeted solutions for the communities facing the greatest need. Although the Latin America region has the lowest regional GHI score in the developing world, Haiti, for example, has the fourth highest GHI score at an “alarming” 36.9. Mexico has a low level of overall hunger, but also contains areas within its borders where child stunting – an indicator of child undernutrition – is relatively high.
“Whilst the world has made progress in the fight against hunger there are still 795 million people condemned to facing hunger every day of their lives,” said Dominic MacSorley, CEO of Concern Worldwide. “This is not just unacceptable, it is immoral and shameful. Resources like the Global Hunger Index provide us with a critical insight into the scale of the global hunger crisis. Agenda 2030 provides us with the ambition and commitment to reach zero hunger. We have the technology, knowledge and resources to achieve that vision. What is missing is both the urgency and the political will to turn commitments into action.”
Another obstacle for reaching zero hunger is the lack of complete data for calculating the index scores for 13 countries. 10 of these countries have indicators like stunting, wasting and child mortality that raise significant concern for having high hunger levels, including Sudan, South Sudan, Somalia, and the Syrian Arab Republic.
“Armed conflict is a leading cause of hunger and undernutrition in many of these countries,” said Bärbel Dieckmann, President of Welthungerhilfe. “Zero Hunger will only be possible if we significantly increase political commitments to conflict resolution and prevention.”
The GHI, now in its 11th year, ranks countries based on four key indicators: undernourishment, child mortality, child wasting and child stunting. The 2016 report ranked 118 countries in the developing world, almost half of which have “serious” or “alarming” hunger levels.
The GHI score for the developing world as a whole is 21.3, which is in the low end of the “serious” category. Regionally, Africa South of the Sahara has the highest hunger level, followed closely by South Asia. Rounding out the top 10 countries with the highest levels of hunger after Central African Republic, Chad, and Zambia are: Haiti, Madagascar, Yemen, Sierra Leone, Afghanistan, Timor-Leste, and Niger.
Around half of the populations of Haiti, Zambia, and the Central African Republic are undernourished – the highest in the report. In Timor-Leste, Burundi, and Papua New Guinea, approximately half of children under five are too short for their age due to nutritional deficiencies.
“The 2030 Agenda set a clear global objective for an end to hunger – everywhere – within the next 14 years,” says David Nabarro, Special Adviser to the UN Secretary-General on the 2030 Agenda for Sustainable Development and Climate Change. “Too many people are hungry today. There is a need for urgent, thoughtful and innovative action to ensure that no one ever goes hungry again.”
Global, Regional, and National Trends
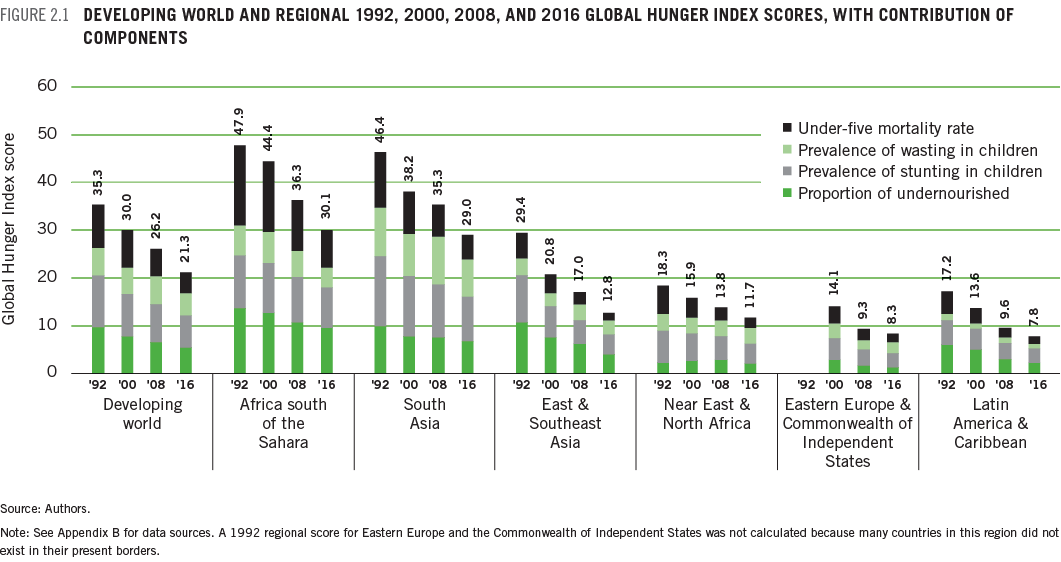
Since 2000, significant progress has been made in the fight against hunger. The 2000 Global Hunger Index (GHI) score was 30.0 for the developing world, while the 2016 GHI score stands at 21.3, representing a reduction of 29 percent (Figure 2.1). To put this in context, the higher the GHI score, the higher the level of hunger. Scores between 20.0 and 34.9 points are considered serious.
Thus while the GHI scores for the developing world – also referred to as the global GHI scores – for 2000 and 2016 are both in the serious category, the earlier score was closer to being categorized as alarming, while the later score is closer to the moderate category. Underlying this improvement are reductions since 2000 in each of the GHI indicators – the prevalence of undernourishment, child stunting (low height for age), child wasting (low weight for height), and child mortality.
Large Regional Differences
The global averages mask dramatic differences among regions and countries. Africa south of the Sahara and South Asia have the highest 2016 GHI scores, at 30.1 and 29.0, respectively. Both reflect serious levels of hunger. In contrast, the GHI scores for East and Southeast Asia, Near East and North Africa, Latin America and the Caribbean, and Eastern Europe and the Commonwealth of Independent States range between 7.8 and 12.8, and represent low or moderate levels of hunger.
Best and Worst Country-Level Results
From the 2000 GHI to the 2016 GHI, 22 countries made remarkable progress, reducing their GHI scores by 50 percent or more. Seventy countries made considerable progress with scores that dropped by between 25.0 percent and 49.9 percent, and 22 countries decreased their GHI scores by less than 25 percent. Despite this progress, 50 countries still suffer from serious or alarming levels of hunger. Since 2000, Rwanda, Cambodia, and Myanmar, positioned at the top of Figure 2.3, have seen the largest percentage reductions in hunger of all the countries categorized as serious or alarming, with 2016 GHI scores down by just over 50 percent relative to the 2000 scores in each country. Each of these countries has experienced civil war and political instability in recent decades, and the improvements may in part reflect increased stability.
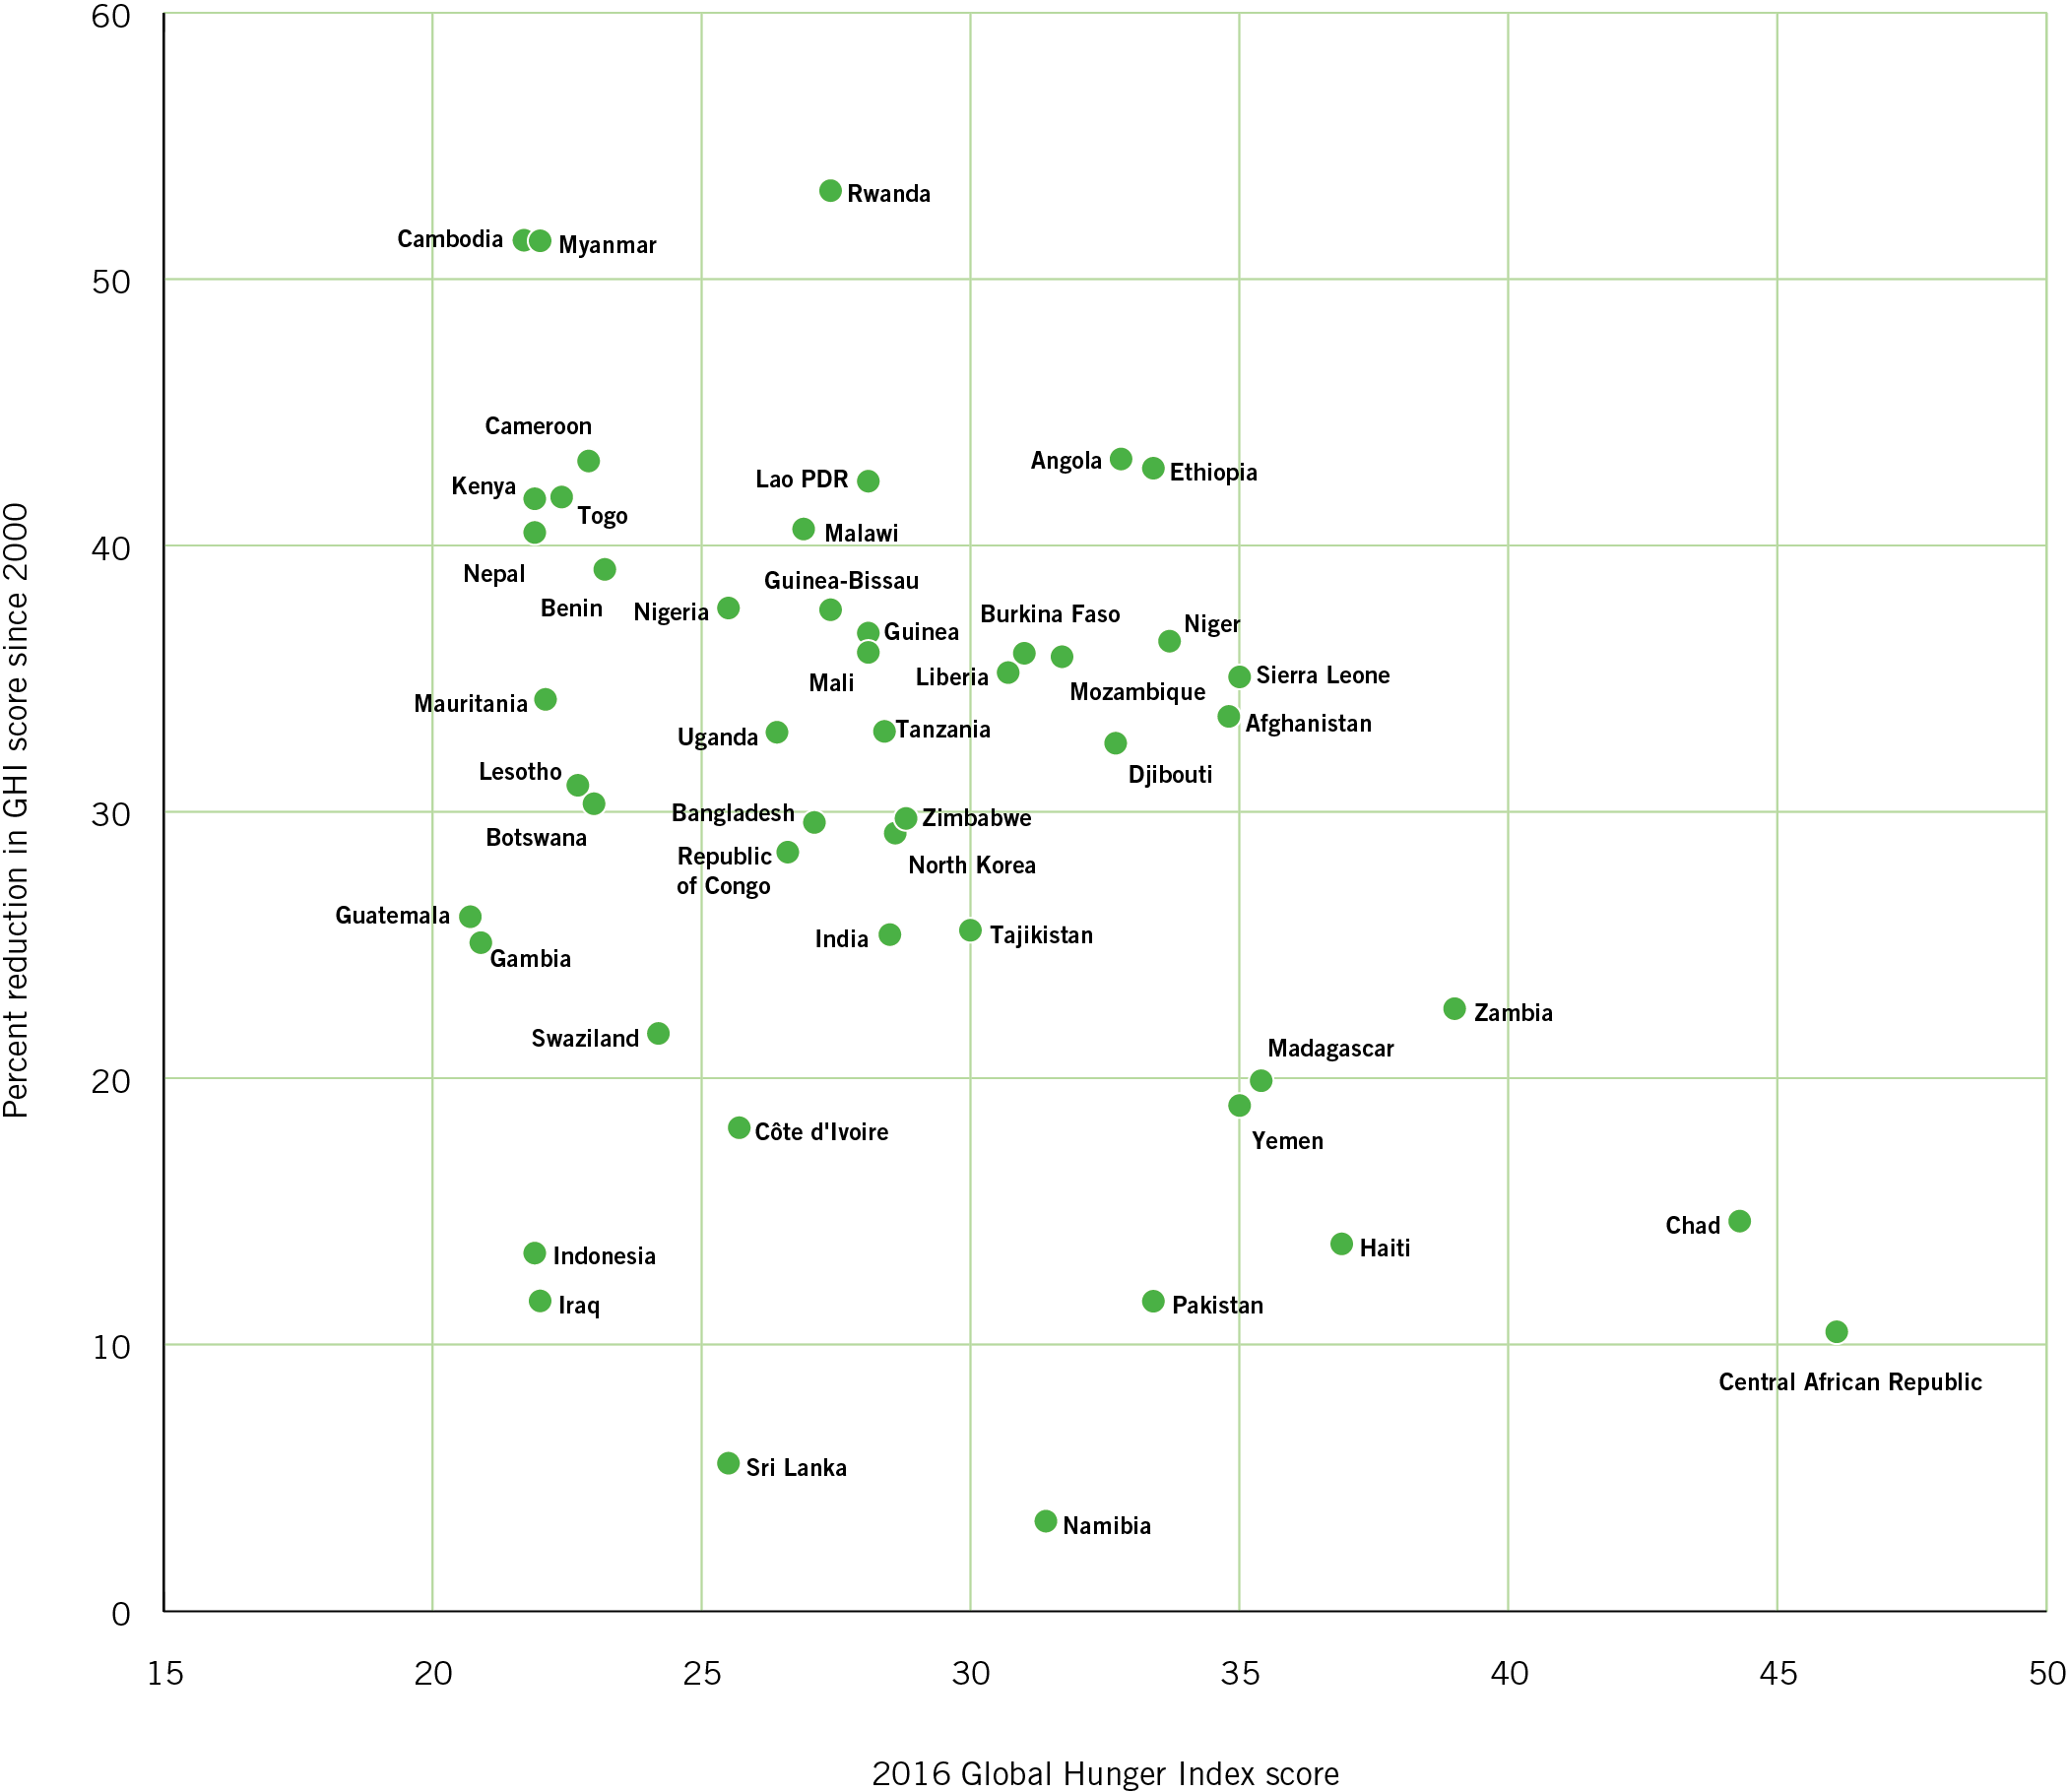
Seven countries still suffer from levels of hunger that are alarming. The majority of those are in Africa south of the Sahara: the Central African Republic, Chad, Madagascar, Sierra Leone, and Zambia. The exceptions are Haiti and the Republic of Yemen. The Central African Republic and Chad, in the lower right-hand corner of Figure 2.3, are obvious areas of concern. These countries have the highest GHI scores in this year’s report, coupled with relatively low percentage reductions in hunger since 2000. In the Central African Republic, violence and mass displacement resulting from a four-year-long civil war have taken a heavy toll on food production (FAO 2016a). Chad, which has also had a long history of civil war, has faced deteriorating food security, due in part to a recent influx of refugees and extreme weather events (FAO 2016b). The examples of these countries underscore that despite significant progress in reducing hunger globally, violent conflict, poor governance, and climate-related impacts on agriculture ensure that hunger continues to plague our planet and requires a transformative plan of action.
Due to insufficient data, 2016 GHI scores could not be calculated for 13 countries; however, based on available data, as well as the available information from international organizations that specialize in hunger and malnutrition, and the existing literature, 10 of these countries are identified as cause for significant concern: Burundi, the Comoros, the Democratic Republic of the Congo, Eritrea, Libya, Papua New Guinea, Somalia, South Sudan, Sudan, and the Syrian Arab Republic. In the absence of GHI scores, it is critical to analyze the available food security and nutrition data to understand the situation in these countries to the greatest extent possible, particularly given that levels of child undernutrition and child mortality in some of these countries are among the highest in the world. Furthermore, it is vitally important that up-to-date data are made available for these countries without delay.
Subnational Hunger and Undernutrition
Examination of individual GHI indicators at the subnational or state levels reveals disparities within countries, both in terms of absolute values and changes over time. Variations in GHI indicator values can exist within countries at all levels of the GHI Severity Scale. For countries that have low hunger and undernutrition levels nationally, examination of data at the subnational level can help identify areas of the country that lag behind, such as in Mexico and Jordan where stunting rates are shown to vary substantially between states. On the other end of the GHI Severity Scale, subnational data for the alarming countries can reveal areas that are in crisis. For example, in Zambia and Sierra Leone, GHI indicators vary widely within each country. In Cambodia, which has seen impressive reduction in its GHI score since 2000, improvements have been uneven between provinces. Such examples of subnational disparities serve as a springboard for further research into the specific causes, circumstances, and challenges of hunger at the subnational level.


